
Forms aren’t dead; this is supported by online form statistics and facts from HubSpot. Their data claims that 74% of businesses use web forms to generate leads, with nearly 50% identifying them as their most effective conversion tool. Whether for customer feedback, lead generation, event sign-ups, or job applications, online forms play a vital role in digital interactions.
This data shows how effective are online forms in today’s digital landscape. Despite the rise of new technologies, forms remain a key tool for businesses and organizations.
However, not all forms perform equally well. Some go ignored, abandoned, or half-filled, leaving businesses with low response rates and incomplete data. The real challenge isn’t just creating a form—it’s understanding what works, what doesn’t, and how users interact with it.
So, we compiled the latest statistics and trends to provide valuable insights into form behavior, from what influences completion rates to the growing role of AI and mobile optimization. With this, you can design smarter, higher-converting forms that capture the needed data—without frustrating users.
Now, we’ll break down 133+ must-know online form statistics, facts, and trends to help you optimize your forms and improve engagement. Plus, we’ll show you how to create your online form with a form creator.
Online form statistics overview
Part I. General online form statistics and facts
Online forms are handy digital tools on the web. They gather user information through text boxes, dropdowns, checkboxes, and submit buttons. After submission, the data is sent to a server for storage or analysis.
These forms have been around since the early days of the internet, starting with something super simple like basic contact forms and leveling up over time. Thanks to advances in web tech, they’ve become way more user-friendly and versatile, making them a must-have for pretty much any business today.
Nowadays, online forms are essential for all kinds of business processes. They make collecting info quick and efficient while boosting user engagement.
For instance, in digital marketing, they’re a key tool for generating leads. Think about it: a random internet person who lands on your website could be a potential customer—and with a subscription form, it’s totally possible! That’s how businesses grow their audience and turn leads into customers.
So yeah, online forms are a big deal for lead management. To further understand the impact and optimization of online forms, consider the following general online form statistics and facts:
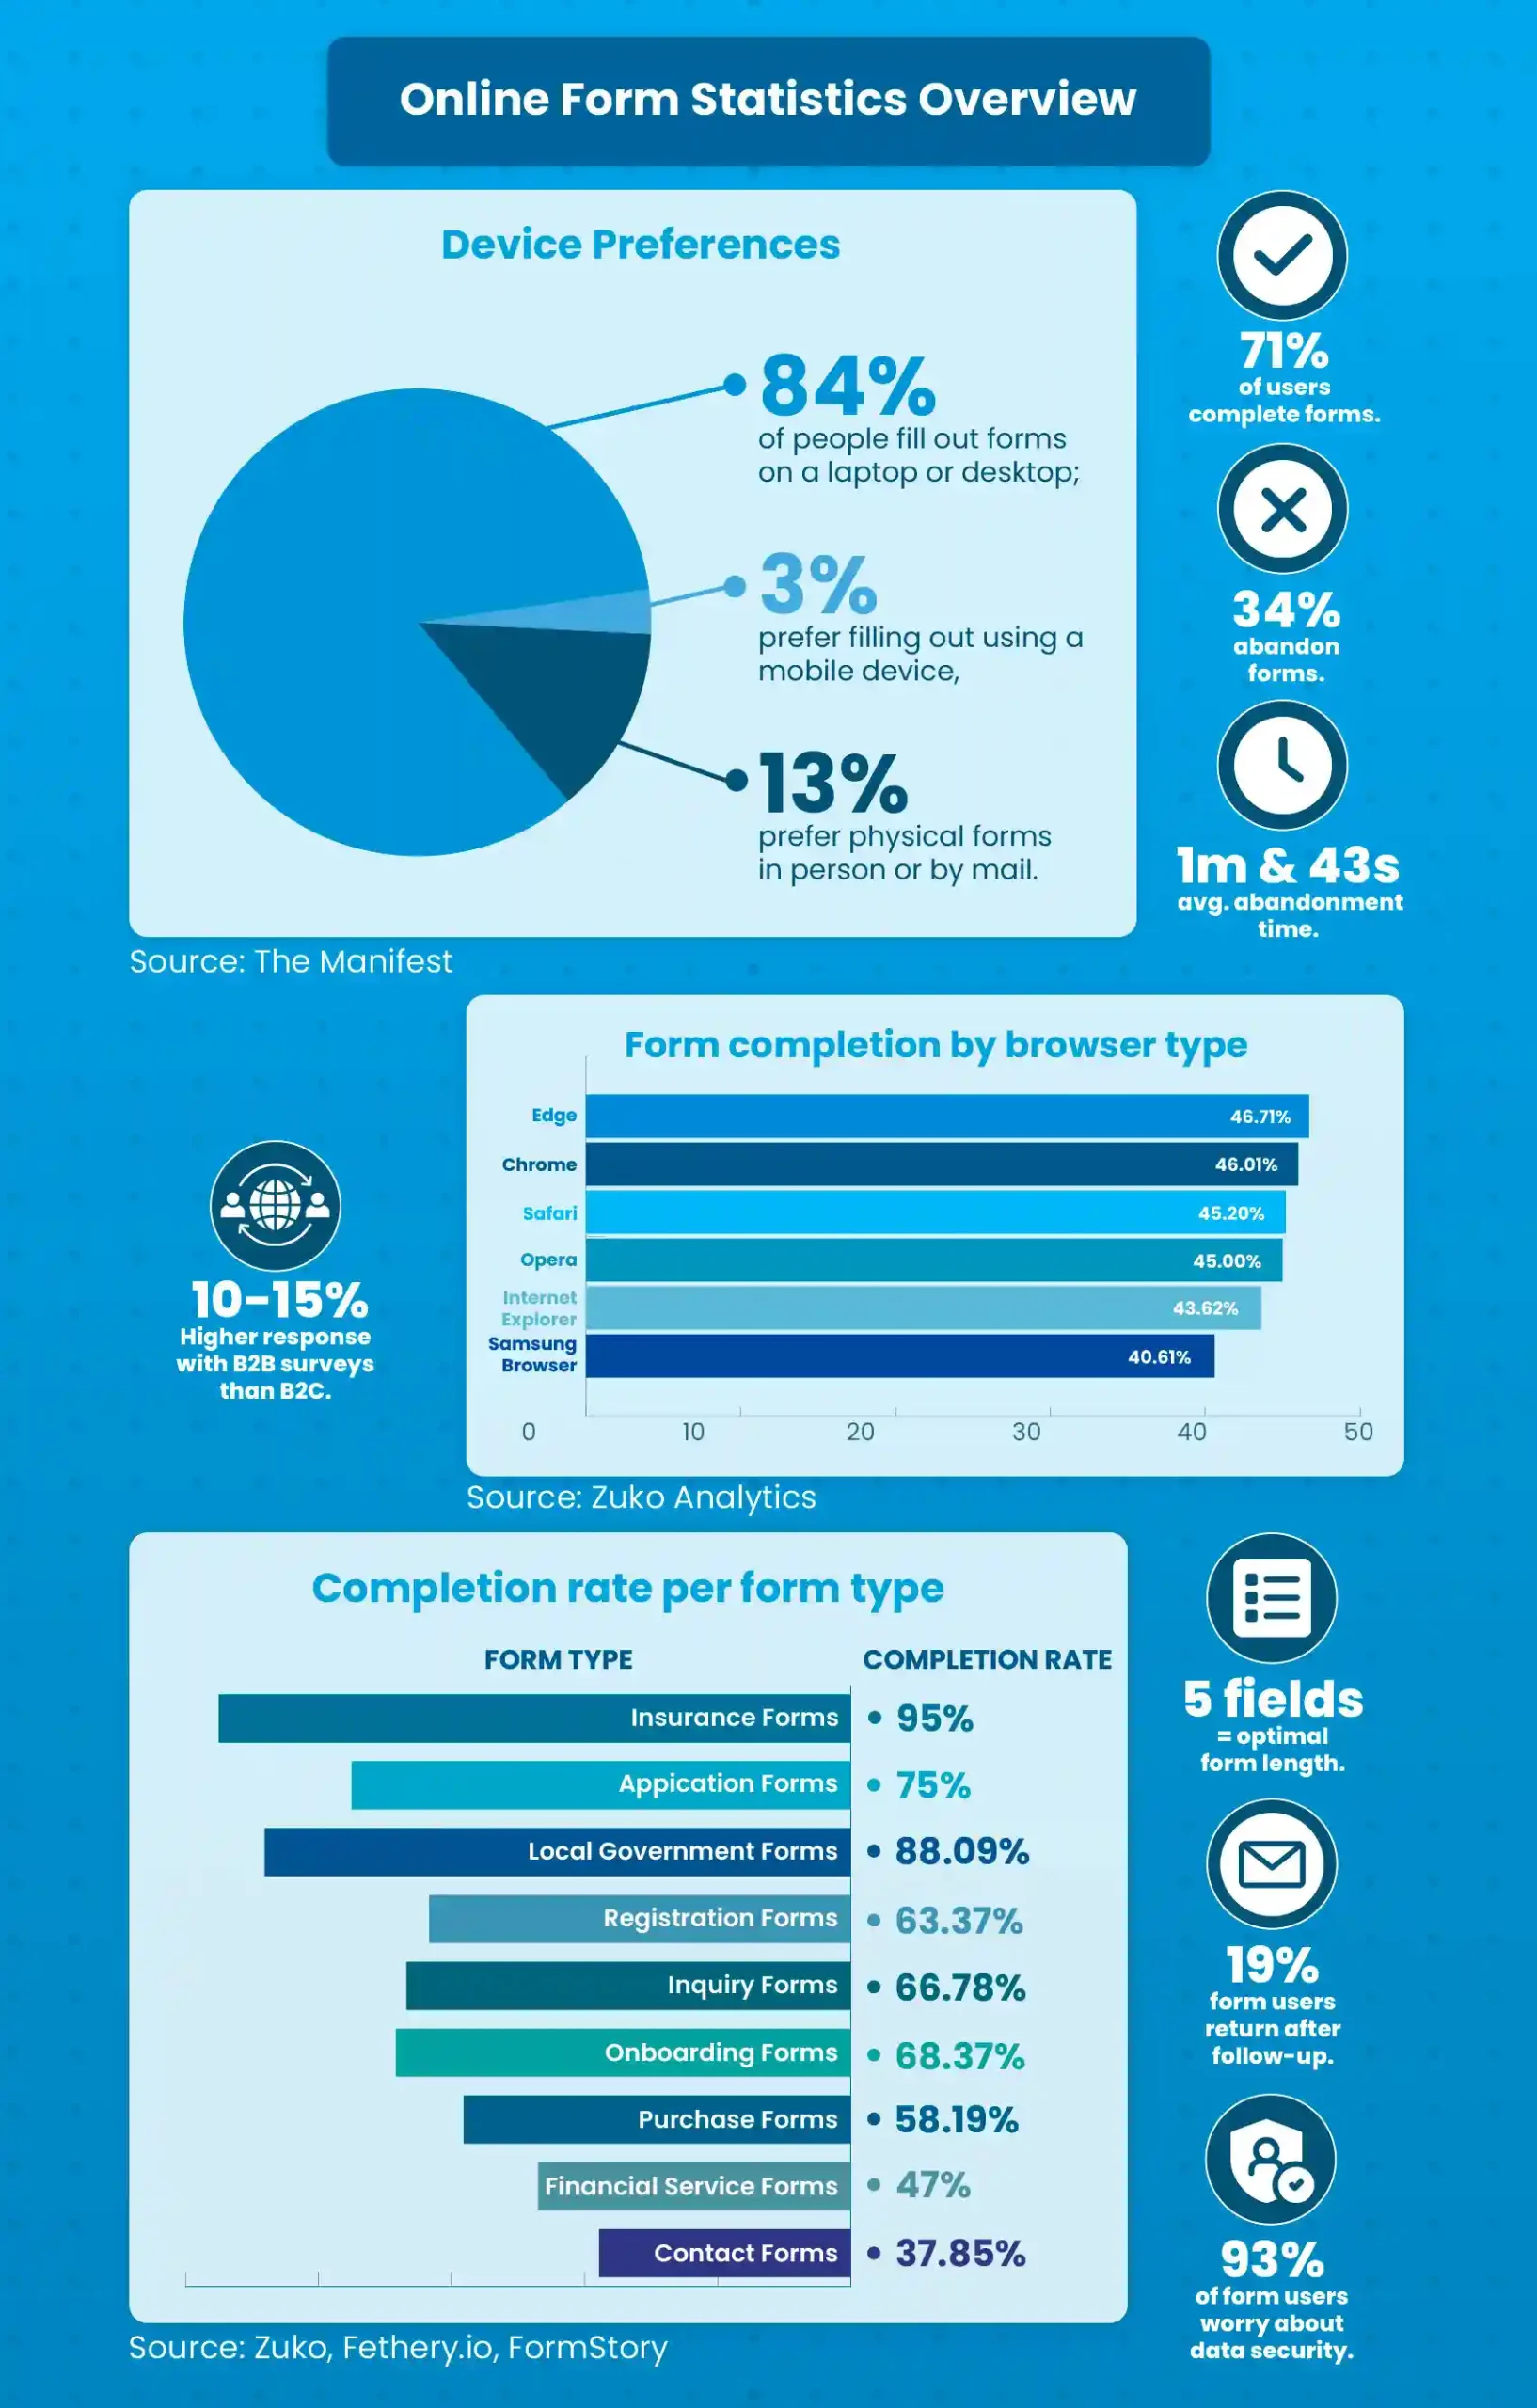
- Among users who start a form, 71% successfully complete it. [Zuko]
- Roughly 34% of users abandon a form before completing it. [Zuko]
- Well-designed forms reduce errors and completion time, improving user efficiency. [Nielsen Norman Group]
- In 2022, the average online form contained five fields—the optimal number for maximizing conversions. [Upform]
- Forcing users to create an account at checkout can deter about 23% from completing the form. [WPForms]
- The average conversion rate for online forms is around 21.5%, though this varies by industry.
- Content and forms placed above the fold account for 57% of users viewing a page. [Nielsen Norman Group]
- In the Forex Trading sector, 69.37% of viewers engage with forms, indicating strong interest. [Zuko]
- Mobile search is used by 27% of the global online population, making voice input a useful alternative for text-heavy forms. [Zuko]
- Only 40% of marketers use multi-step forms, and among those who do, 17% credit them as a key factor in their lead generation success.
- Static forms outperform pop-up modal forms, achieving an average success rate of 45.53% compared to 25.96%. [Factors.ai]
- Call-to-action (CTA) buttons using phrases like “Click Here,” “Go,” “Download,” and “Register” tend to drive the highest engagement. [Quicksprout]

Part II. Online form usage statistics
Form usability and error reduction
Forms that follow usability best practices help users complete them with fewer mistakes. Simple changes, like inline validation, can make a big difference in user experience. The fewer errors users encounter, the faster and more smoothly they can complete a form. Here are statistics for your insights:
- Forms that follow usability guidelines see a big improvement in error-free submissions—78% of users submit these forms without mistakes on the first try, compared to just 42% for forms that don’t meet usability standards. [Zuko Analytics]
- Inline form-field validation reduces form errors by 22% and completion time by 42%. [CXL]
- Users revisit 4.55% of previously filled fields in a form. [Zuko Analytics]
Device preferences and completion rates
Users overwhelmingly prefer filling out forms on desktops and laptops rather than mobile devices.
According to Zuko’s online form analytics, desktop visitors show a higher intent to complete forms, with a 47% view-to-starter rate, compared to 42% on mobile and 41% on tablets.
Research from The Manifest supports this, showing that 84% of people actively choose to fill out forms on a laptop or desktop. In comparison, only 3% prefer using a mobile device, and 13% prefer filling up physically in person or by mail.
This preference is likely due to easier typing on a full keyboard, better screen visibility, and more optimized form layouts on desktops. While mobile devices dominate online browsing, form completion rates remain significantly higher on larger screens.
Form types and popularity
The design and structure of a form impact its performance. Certain field combinations are more common, and different form placements affect conversion rates. Businesses also rely on forms as a key tool for lead generation, making it important to optimize their structure.
- Popups account for 66% of all signup forms, but landing pages perform best with a 23% signup rate. [Hubspot]
- The most common field combination is email address and name (7%), followed by email address and birthdate (5.7%). [Omnisend]
- 74% of businesses rely on digital forms for lead generation, and 49.7% say they are their most effective conversion tool. [Hubspot]
- Comparison forms typically have the highest number of required fields. [Zuko Analytics]
Industry-specific engagement (view to starter %)
Form engagement levels vary across industries. Some sectors, like legal services and local government, see high engagement rates, while eCommerce and gambling have lower interaction levels. This suggests that users in some fields are more motivated or required to complete forms, while others may hesitate due to complexity or lack of urgency. Here is the form engagement percentage per industry according to Zuko:
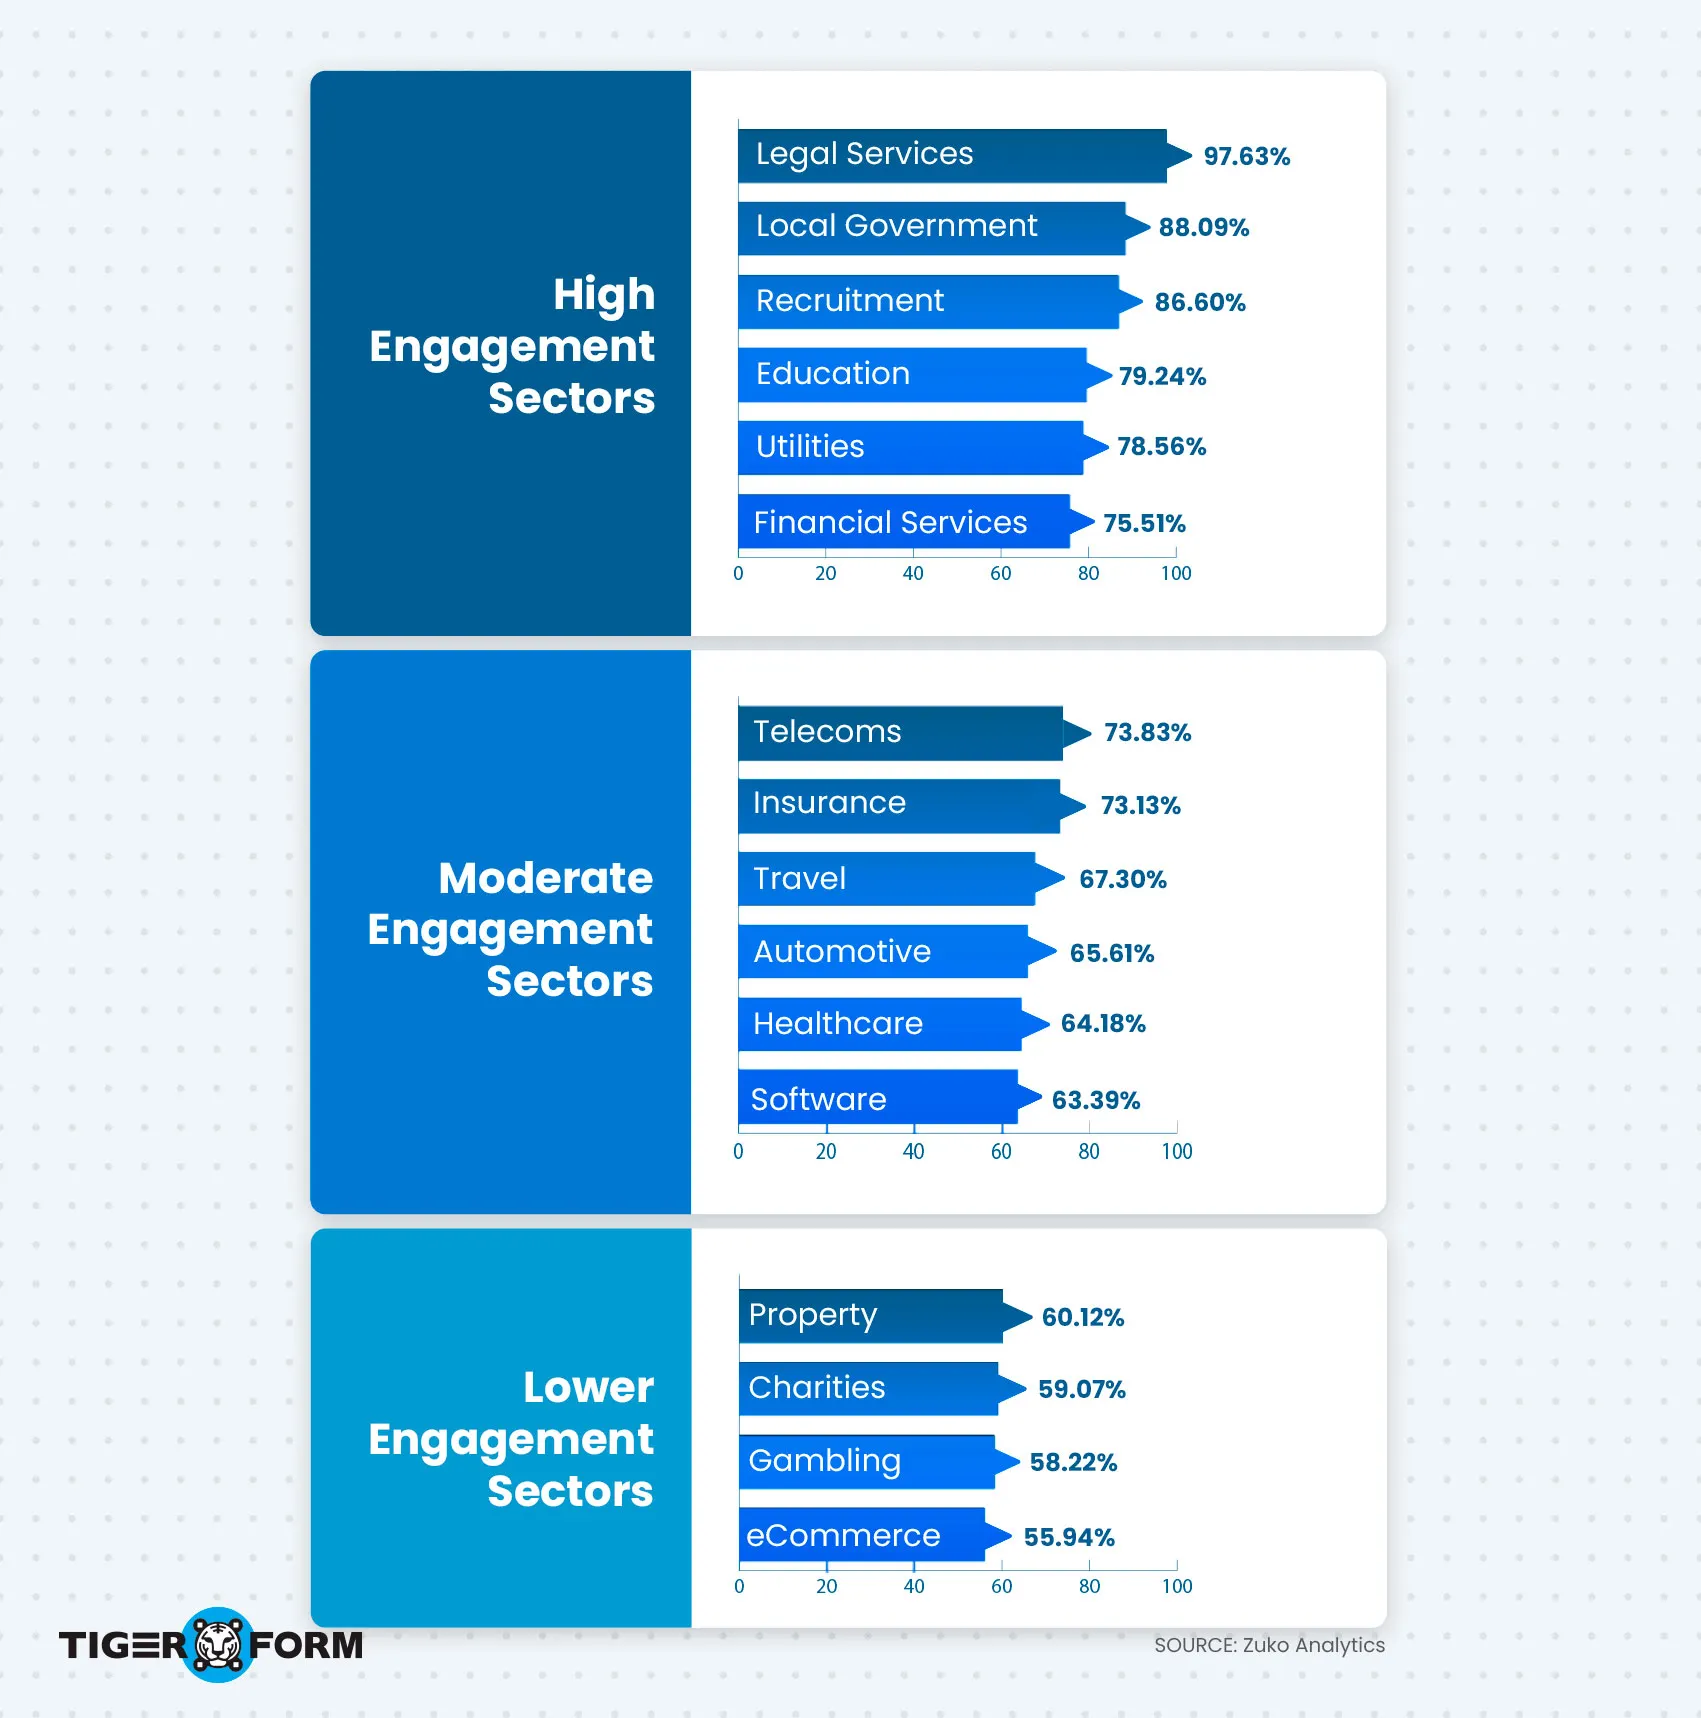
The Education, Utilities, and Financial Services sectors all show strong engagement, with ‘View to Starter %’ above 75%.
Survey and response rates
Survey forms generally have lower response rates compared to other form types. Response rates for standard surveys range from 5% to 30%, but B2B surveys tend to perform better with 10-15% higher response rates than B2C. This suggests that professionals may be more willing to engage with surveys relevant to their field.
Form completion by browser type
The browser a user is on can also influence form completion rates. Edge and Chrome users show slightly higher conversion rates than Safari and other browsers. While these differences aren’t extreme, they suggest that browser compatibility and performance might affect how easily users complete forms. Here are the numbers from Zuko Analytics:
- Edge: 46.71%
- Chrome: 46.01%
- Safari: 45.20%
- Opera: 45.00%
- Internet Explorer: 43.62%
- Samsung Browser: 40.61%
Part III. Form types , statistics, and facts
Not all forms perform the same—some are quick and easy to complete, while others cause users to drop off before finishing. The number of fields, complexity, and purpose of a form affect how likely users are to complete it.
Understanding how different form types perform can help refine your approach to form design, improving user experience and conversion rates. Here’s a breakdown of online form statistics and facts per type:
- Just 9.09% of users who come across a contact form actually submit it. [Zuko]
- Comparison forms are abandoned the fastest, with users leaving after an average of 50 seconds. [Zuko Analytics]
- Configuration forms require the least input, averaging just four fields. [Zuko Analytics]
- Comparison forms are the most demanding, typically requiring 36 fields to be filled out. [Zuko Analytics]
- Around 63.37% of registration forms are fully completed once users begin filling them out. [Zuko]
- Almost 95% of users who begin insurance forms follow through to completion. [FormStory]
- About 74.51% of application forms get completed once started. [Zuko]
- Local government forms are lengthy, averaging 71 input fields and taking roughly 8.5 minutes to complete. [Zuko Analytics]
- Purchase forms see a completion rate of 58.19% after users start filling them out. [Zuko]
- Inquiry forms are completed 66.78% of the time once users begin. [FormStory]
- Onboarding forms have a 68.37% completion rate after users start the process. [Feathery.io]
- Contact forms struggle with completion, with only 37.85% of users finishing them once started. [Zuko]
- Forms in the property sector take approximately 7.5 minutes to complete. [Feathery.io]
- Filling out a checkout form takes an average of three minutes and 21 seconds. [Zuko]
- Online application forms have the highest completion rate, with 75% of users finishing them once they begin. [Zuko Analytics]
- Contact forms convert the least, with only 38% of users successfully submitting their details. [Zuko Analytics]
- Purchase forms take the longest to complete, averaging three minutes and 21 seconds. [Zuko Analytics]
- Registration forms are the quickest to fill out, taking around one minute and 35 seconds on average. [Zuko Analytics]
- Financial services forms have a 47% conversion rate, meaning fewer than half of users complete them. [Zuko Analytics]
- Education sector forms require the most corrections, with users going back to edit an average of seven fields. [Zuko Analytics]
- Application forms top the charts with a 75% completion rate after users begin filling them out. [Zuko Analytics]
- Surprisingly, 88% of mobile sites have a ‘poor’ or ‘mediocre’ layout for their account-selection step, making it difficult for users to find the guest checkout form and increasing abandonment rates. [Baymard]
Part IV. Digital form user behavior
Completion and abandonment rates
Let’s be honest—most of us have abandoned an online form at some point. In fact, 80% of users have recently left at least one form incomplete [The Manifest]. This isn’t surprising, as people often get distracted or hesitate due to concerns like security or effort. However, the likelihood of users returning depends on certain factors.
- Reminders work—20% of users will return to complete a partially filled form if they receive a follow-up link [Formsort].
- Incentives matter—30% of users are more likely to finish a form if offered something in return, such as a free tool [Insiteful].
Beyond these patterns, here are some key statistics on form completion and abandonment behavior:
- 66% of users who start filling out a form complete it, but only 45% of total visitors convert [Zuko Analytics].
- Two out of three users who start a form will finish it [Zuko Analytics].
- On average, users abandon a form after 1 minute and 43 seconds [Feathery].
- Over 67% of visitors will permanently abandon a form if they encounter any issues, while only 20% will contact the company for help [Insiteful].
- 19% of users will return and complete a form if they receive a follow-up via email or phone call [Insiteful].
A. How does your form’s structure impact submissions
How a form is structured plays a major role in whether users complete or abandon it. According to The Manifest, 27% of users abandon a form if it’s too long, 11% leave due to ads or upsells, and 10% exit when the reason for data collection is unclear. This highlights the importance of designing forms with only essential fields, minimizing distractions, and clearly communicating the form’s purpose.
- Single-column forms are completed 15.4 seconds faster than multi-column ones [CXL], as they provide a clearer flow for users
- Two-column forms often confuse users and increase abandonment rates [Insiteful].
- Multi-page forms tend to have higher completion rates than single-page forms [Formstack], suggesting that breaking forms into steps makes them feel more manageable.
Beyond structure, the specific fields included in a form can also influence user behavior. Some fields require extra effort or cause frustration, leading users to abandon the form altogether. Here are some statistics on each form field type:
- The Password field has the highest abandonment rate at 10.50%, with users spending 7.2 seconds on it, often due to input errors or complexity [Zuko Analytics].
- The Email Address field sees a 6.41% abandonment rate, with users taking around 6.5 seconds to fill it out [Zuko Analytics].
- The Phone Number field has an abandonment rate of 6.28%, with users spending an average of 5.0 seconds on it [Zuko Analytics].
- The Address field takes the longest to complete, at 7.4 seconds on average, likely due to multiple input lines [Zuko Analytics].
- The Name and Postcode fields have the lowest abandonment rates, at 5.27% and 4.82%, respectively, with completion times of 3.5 and 3.8 seconds [Zuko Analytics].
- Forms that include dropdown fields tend to have the highest abandonment rates [WPForms].
Aside from fields, even minor form elements can influence whether users complete or abandon a form. Here are small design choices that improve submission rates and reduce drop-offs:
- Personalized call-to-action buttons (instead of generic ones like “Submit”) can boost conversions by over 200% [HubSpot].
- Forms with radio buttons are completed 2.5 seconds faster than those with dropdown menus [CXL].
- Using the word “Submit” on a button increases abandonment by 3%, as it feels transactional and impersonal [Insiteful].
- Enabling CAPTCHA leads to higher form abandonment rates, as users may find it inconvenient [Moz].
- Placing labels above form fields improves completion rates [Insiteful].
- Autofill speeds up form completion, with 23% of users relying on it [Zuko Analytics]. Those who don’t use autofill see a completion rate drop to 59% [Zuko Analytics].
B. Completion and abandonment rates by form type
- Over 80% of shoppers abandon booking and checkout forms [SaleCycle]
- 50% of employers claim the length of their job application forms is effective at weeding out applicants who don’t want to finish. [SHRM]
- The average form abandonment rate is highest for the automotive industry (82%), followed by travel (49%), eCommerce (49%), and property (48%). It’s lowest for local government (3%) and insurance (6%). [Zuko]
- Unexpected costs or hidden fees can cause 12% of users to abandon a form at checkout. [Baymard]
- 60% of shoppers will abandon a checkout form if there is no return policy or the return policy is unclear. [SureCart]
- The average checkout form contains twice as many fields as necessary. [Baymard]
Conversion rates
Conversion in online forms refers to the percentage of users who start filling out a form and successfully submit it. A high conversion rate means a form effectively achieves its goal— capturing leads, processing registrations, or completing purchases. But what influences conversion rates? One major factor is form length and field count.
A. How form length affects conversions
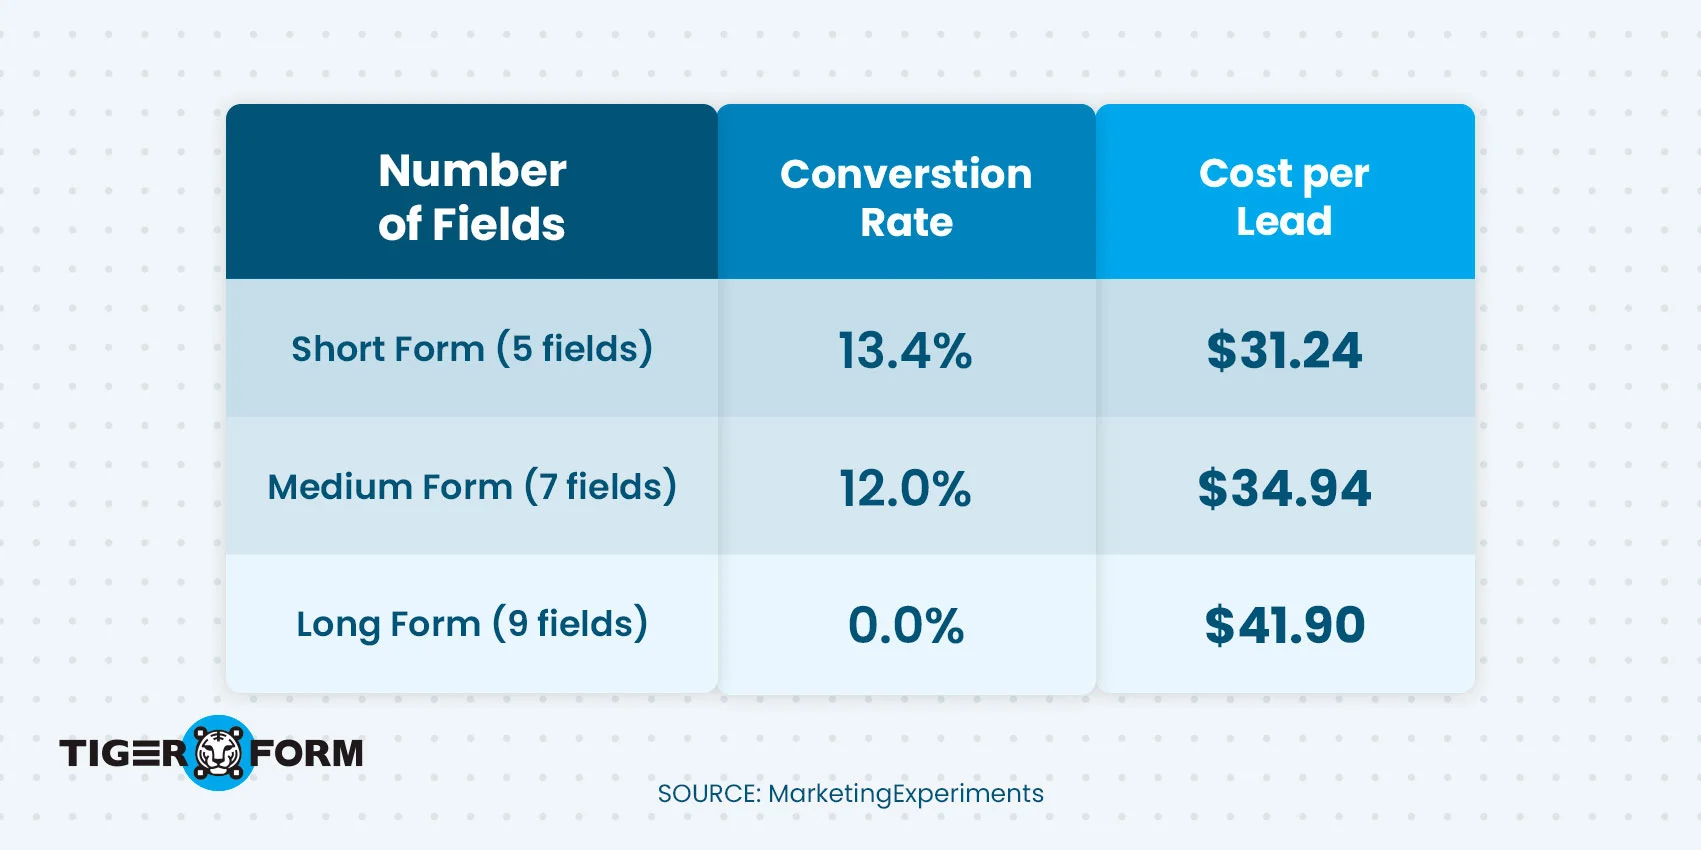
The number of fields in a form plays a crucial role in whether users complete or abandon it. Shorter forms tend to have higher conversion rates, requiring less effort. However, removing necessary fields can backfire if users do not provide enough relevant information.
A study by MarketingExperiments highlights how the number of fields affects conversions:
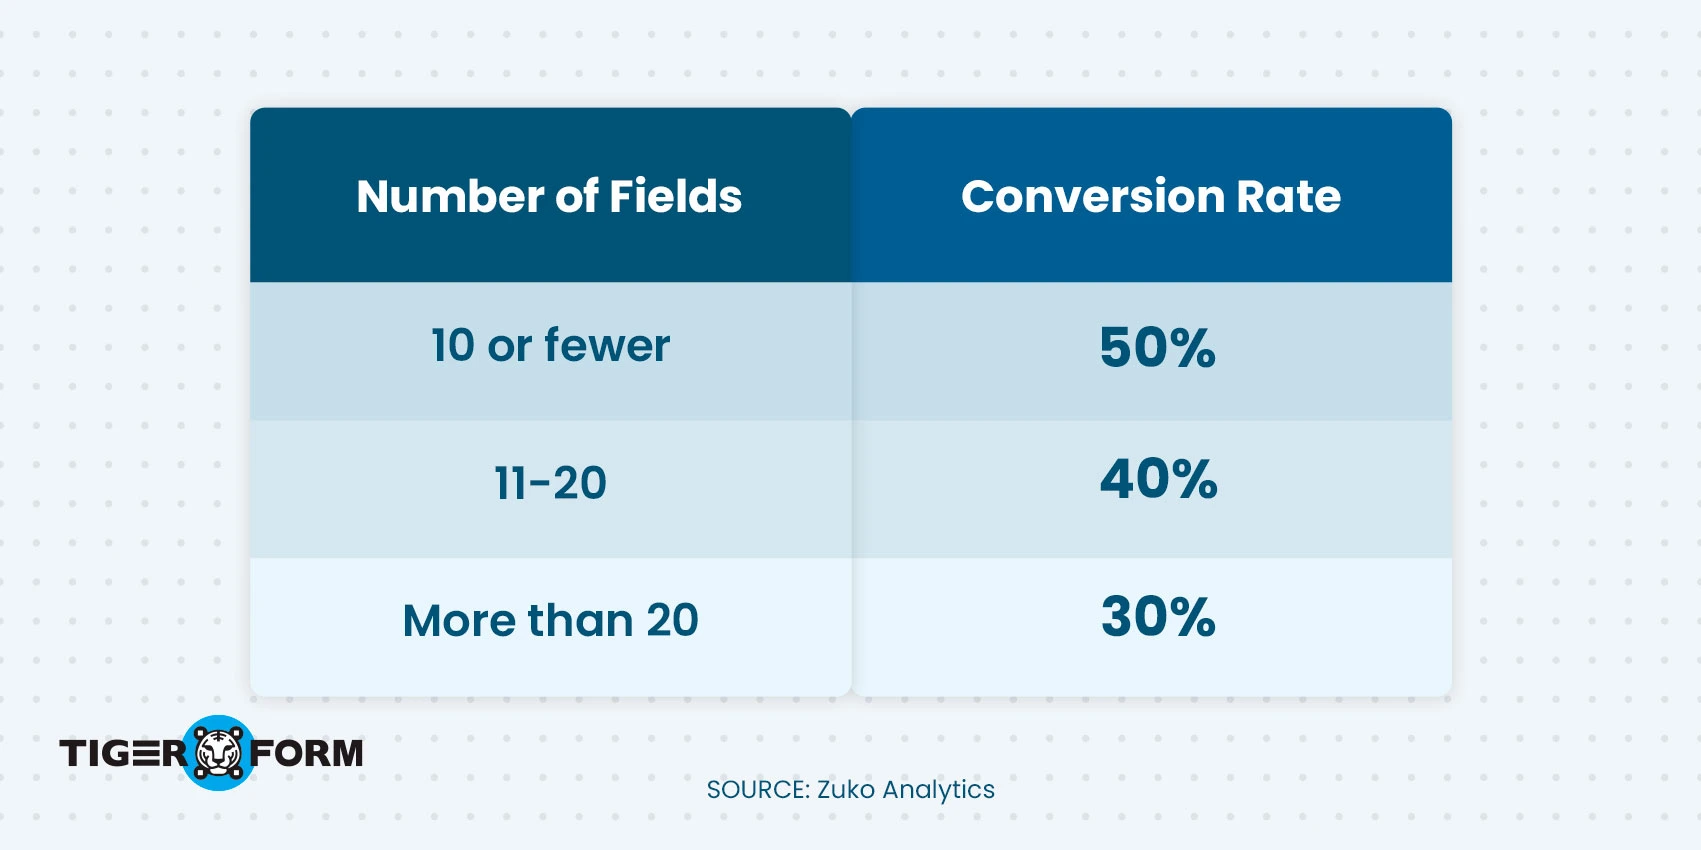
Zuko Analytics provides additional insights on the impact of field count:
Here are various reports that reveal the ideal field number for high conversions:
- Forms with three fields convert the highest, with an average rate of 10%. [Omnisend]
- 30.7% of marketers believe the ideal number of questions on a landing page form is four. [HubSpot]
B. Multi-step forms vs. Single-step forms
How you structure your form—whether as a single-step or multi-step process—can significantly impact conversion rates. Multi-step forms perform better because they break down long forms into smaller, more manageable sections, keeping users engaged and reducing form abandonment. Here’s what the data says:
- Multi-step forms with one question per step convert 86% higher than single-step forms with many questions. [HubSpot]
- Using multi-step forms can increase conversions by up to 300%. [Zuko Analytics]
- A four-step form with 30+ questions achieved a 53% conversion rate by reducing perceived friction. [Venture Harbour]
C. The role of form structure and design
Your form’s structure and design play a major role in determining its conversion rate. A well-optimized form can encourage more users to complete it, while a poorly designed one may cause drop-offs. Let’s break down some key findings:
- Removing important fields led to a 14% drop in conversions, but restoring them increased conversions by 19.21% [ConversionXL]. Users engage better when forms feel complete and relevant to their needs.
- Inline validation can boost conversion rates by 22% [Zuko Analytics]. Real-time feedback prevents users from making mistakes, reducing frustration and improving completion rates.
- A study by Luke Wroblewski found that inline validation helped users complete forms faster, with fewer errors and greater satisfaction. [Market Splash]
- Forms using inline validation saw a 22% boost in completion rates. [Market Splash]
- Removing the reset button can increase conversions by 20% [Zuko Analytics]. A reset button creates unnecessary hesitation, as users might fear losing their progress.
- Personalized call-to-action buttons can improve conversion rates by 42% [Zuko Analytics]. Make your CTA buttons personalized (e.g., “Get My Free Quote” or “Join Now”).
- Simplifying language in form fields can increase conversions by 15% [Zuko Analytics]. Complex terms or vague labels may confuse them, leading to abandonment.
D. Field-specific impact on conversions
The fields you include in your form greatly affect conversion rates. Asking for too much information—or making certain fields mandatory—can discourage users from completing the form. Studies show that simplifying forms and adjusting field requirements can lead to higher submission rates. Here are statistics on field-specific impact on form conversions:
- Including a phone number field can decrease conversion rates by up to 5%. [Zuko Analytics]
- Changing the phone number field from mandatory to optional can result in a 275% increase in capture rates. [MarketingSherpa]
- Making certain fields optional can increase the lead rate by 275%, and removing unnecessary fields can increase email capture rates by 28%. [MarketingExperiments]
E. Context and placement in form conversion
Where and how you present your form can significantly influence its performance. The context around the form and its placement on the page determines how users interact with it. Misplaced forms or unnecessary distractions can reduce conversions, while strategic placement can enhance engagement.
- Placement and context matter—adding copy above a donation form reduced conversions by 28%. [MarketingExperiment]
- Contest entry forms have the highest average conversion rate, with 35% of visitors completing the submission. [MarketingProfs]
- Local Government forms have a view-to-completion rate of 85%. [Zuko Analytics]
- Users who abandon recruitment forms spend longer on them than those who complete them. [Zuko Analytics]
F. Incentives, engagement, and lead generation
Incorporating incentives or interactive elements can significantly increase conversions. Forms with quizzes, gamification, or eye-catching visuals do better than plain, text-heavy ones. Here are some interesting findings that back this up:
- Optimizing a complex online form increased lead generation by 226% without reducing the number of fields. [MarketingExperiments]
- Using a quiz-like form can triple conversions. [Insiteful]
- Popup forms with images increase conversion rates by 1.8x compared to text-only popups. [SleekNote]
- Popups (immediate, exit-intent, etc.) were the most popular signup form but had the second-lowest conversion rate (3%). [Omnisend]
- Landing pages, the least popular signup form, had the highest conversion rate (23%), followed by the interactive Wheel of Fortune (10%). [Omnisend]
G. Key elements of high-performing forms
A successful form is more than just a collection of fields—it should be designed with user experience at its core. According to Venture Harbour, five key elements contribute to form completion: engagement, ease of use, peace of mind, ability, and motivation.
Additionally, conversion rates are influenced by factors such as the type of conversion, user expectations, incentives, the amount of required information, formatting, and best practices. Optimizing forms with these elements ensures they effectively capture leads and drive action.
Part V. Security and compliance in web forms

Security and compliance in online forms are crucial for legal reasons and user trust. According to SourceDefense, 93% of users worry about data security when submitting forms, so businesses must prioritize protection.
Strong security measures are essential due to threats like phishing, data breaches, and spam bots. Plus, 91% of users believe companies should be responsible for safeguarding their data, even if third parties handle the forms.
Regulations like GDPR, CCPA, and HIPAA set strict data collection, storage, and consent rules. Non-compliance can lead to fines and reputational damage, while cybercriminals often target forms to steal data or inject malware.
To reduce risks, use SSL encryption, CAPTCHA, anti-bot tools, and multi-factor authentication (MFA). Limit data collection to only what’s necessary to minimize exposure and build user confidence. The Manifest studies show that 29% of users abandon forms due to security concerns, so prioritizing compliance and security can boost completions, build trust, and create a safer experience.
Part VI. Emerging trends in online forms
As technology advances, online forms are undergoing huge transformations, becoming more intelligent, efficient, and user-centric. Two emerging trends are AI-powered forms and QR code integration. Both make online forms more efficient, accessible, and easier to use.
AI-powered forms
McKinsey & Company reported the state of AI in their global survey, 55% of respondents claimed they used AI generation in at least one of their business functions in 2023. This number increased by 72% in early 2024, reaching 78% in 2025. This significant growth impacts how business workflows operate, particularly online, and complements the rising trend of AI integration into online forms.
AI-powered forms change how businesses create, manage, and optimize online forms. With AI-driven form builders, businesses can now generate forms automatically based on simple descriptions, eliminating the need for manual setup.
Beyond form creation, AI enhances user interaction by analyzing behavior in real-time, offering predictive text suggestions, and personalizing form fields to increase completion rates.
Additionally, AI is critical in processing collected data, providing businesses with actionable insights into customer preferences, and enabling more informed decision-making. This combination of form automation and intelligence transforms static features into dynamic, adaptive solutions.

QR code-powered online forms
QR TIGER’s QR code statistics report claims a 47% yearly increase in global QR code generation. This surge in QR code usage highlights the growing reliance on quick, seamless digital interactions, making their integration into online forms more relevant than ever.
Integrating QR codes into online forms is a rising trend that is reshaping how users access and interact with forms. A form QR code generator enables businesses to create unique QR codes that instantly open forms on mobile devices, eliminating the need to search for links or navigate multiple web pages manually.
This simplified process is particularly valuable in hospitality, healthcare, and event management, where contactless interactions are increasingly important. For example, hotels use QR codes for guest feedback, healthcare providers streamline patient intake forms with QR codes, and businesses embed QR codes in print materials to collect customer feedback.
How to create a simple online form with TIGER FORM?
Step 1
Register for an online form builder that enables effortless online form creation.
Step 2
Select a template or create your form from scratch.
Step 3
Include the required fields and adjust the design to match your brand’s style.
Step 4
Create a QR code that directs users straight to your form. Customize it according to your preferences.
Step 5
Save the QR code in a printable format for physical distribution or a digital format for online sharing.
Step 6
Utilize the platform’s dashboard to track submissions, analyze performance, and optimize your form.

The future of online forms
That wraps up a closer look at online form statistics, facts, and trends—from how they’ve evolved to their role in businesses today. Whether improving lead generation, simplifying data collection, or making forms more user-friendly, adapting to new trends is key to keeping them effective.
One shift gaining traction is the use of QR code forms. These allow users to access and complete forms instantly with just a scan. From event check-ins to contactless transactions, they offer a quick and convenient way to collect information while improving accessibility.
As businesses refine their approach to online forms, discovering tools that enhance usability and security can significantly impact them. Whether it’s a simple feedback form or a more detailed application, optimizing efficiency ensures a smoother experience for businesses and users.
Create your online forms with TIGER FORM now!
FAQs
What makes an online form user-friendly?
A user-friendly online form is simple, clear, and quick to access. It minimizes unnecessary fields, provides clear instructions, and uses inline validation for real-time error correction. Making forms work well on all devices, along with multi-step layouts, autofill, AI integration, and QR code access, makes them even more accessible and user-friendly.
How can businesses increase form completion rates?
Businesses can improve form completion rates by keeping forms short, using multi-step layouts, and reducing required fields. Offering incentives like discounts or free resources can boost submissions. Ensuring forms are mobile-friendly and distraction-free also helps prevent users from abandoning them.
Why are statistics important?
Statistics are essential for understanding patterns, identifying trends, and making informed decisions. They provide factual insights that replace guesswork, helping to analyze data, solve problems, and improve outcomes in areas like the digital business world.
Sources:
https://www.zuko.io/blog/25-conversion-rate-statistics-you-need
https://www.marketingprofs.com/charts/2015/27318/conversion-benchmarks-for-seven-types-of-online-forms
https://ventureharbour.com/how-form-length-impacts-conversion-rates/
https://marketingexperiments.com/conversion-marketing/optimizing-web-forms-2
https://marketingexperiments.com/lead-generation/do-optional-form-fields-help-or-hurt-conversion
https://marketingexperiments.com/lead-generation/live-from-email-summit-201
https://sherpablog.marketingsherpa.com/email-marketing/optimizing-email-capture-checklist
https://marketingexperiments.com/lead-generation/lead-generation-testing-form-field-length-reduces-cost-per-lead-by-10-66
https://blog.hubspot.com/marketing/state-of-email-lead-capture
https://blog.hubspot.com/marketing/landing-page-stats
https://marketingexperiments.com/a-b-testing/nonprofit-testing-how-one-small-change-led-to-190-increase-in-clickthrough
https://ventureharbour.com/multi-step-lead-forms-get-300-conversions
https://conversionxl.com/reduce-form-fields/
https://sleeknote.com/blog/popup-statistics
https://www.omnisend.com/blog/best-signup-forms-conversions
https://sourcedefense.com/company/press/93-of-consumers-concerned-about-data-security-when-filling-out-online-forms
https://themanifest.com/web-design/blog/6-steps-avoid-online-form-abandonment
https://www.zuko.io/blog/which-form-fields-cause-the-biggest-ux-problems
https://www.quicksprout.com/contact-form-conversion-rate/?display=wide
https://www.hubspot.com/marketing-statistics
https://www.upform.com/blog/web-form-statistics/
https://insiteful.co/blog/form-abandonment-statistics/
https://www.zuko.io/benchmarking/industry-benchmarking
https://wpforms.com/online-form-statistics-facts/
https://www.zuko.io/blog/does-browser-autofill-affect-form-conversion-rate
https://marketsplash.com/tag/statistics/
https://www.nngroup.com/articles/web-form-design/
https://formsort.com/article/key-form-completion-stats-in-2023/
https://www.salecycle.com/blog/strategies/form-abandonment-can-avoid/
https://www.shrm.org/topics-tools/news/technology/study-job-seekers-abandon-online-job-applications
https://baymard.com/blog/checkout-flow-average-form-fields
https://surecart.com/reduce-shopping-cart-abandonment