
Ranking questions exist because rating everything a 4 out of 5 tells you almost nothing.
If a restaurant runs a customer survey after a busy Saturday night based on food, service, ambiance, value — all rated between 4 and 4.5 stars — the manager stares at the results, unsure what to fix first, because everything looks fine, and nothing stands out. So nothing changes.
That’s the trap of rating questions. When respondents can give everything a high score, they usually do. It’s easier. It’s polite. And it produces data you can’t act on.
Ranking questions fix that. Respondents can’t score everything equally; they have to choose. And that’s exactly where honest, usable data comes from.
Below, we cover everything you need to know: what ranking questions are, the types, ranking survey questions examples, when to use them, and how to build your first ranking survey.
What is a ranking question?
A ranking question asks respondents to arrange choices from most to least important or preferred. The order is based on each respondent’s personal preferences, priorities, or sense of importance — depending on the question.
As a type of closed-ended question, a ranking query pushes respondents to make a definite choice. That structure tends to produce more honest, more useful answers.
Take these two questions as an example: “How important is free shipping to you?” versus “If you had to choose, what matters more: free shipping, a lower price, or a faster delivery date?”
The first question lets respondents think up an answer from scratch. The second gives them concrete options to weigh against each other, which is where real preferences show up.
And if a respondent ranks “price” as number one, something else has to be number two. That constraint is exactly what makes the data real.
Ranking questions vs. rating questions
| Factor | Rating questions | Ranking query |
| Scale type | Independent per item | Relative across items |
| Ties allowed | Yes | No |
| Cognitive load | Low | Medium–High |
| Best for | Measuring attitude or satisfaction | Identifying priorities and trade-offs |
| Data type | Interval (can average) | Ordinal (cannot average meaningfully) |
| Risk of satisficing | Higher | Lower |
These two survey question types look similar but produce very different data. Knowing when to use each one is half the battle.
Rating questions ask respondents to evaluate each item on an independent scale, like 1 to 5 stars; items don’t compete. Everything can score a 5 if the respondent feels like it. This works well for measuring attitude, satisfaction, or how strongly someone agrees with a statement.
Ranking query makes items compete directly against each other. If one rises, another falls. They’re built to understand relative priorities and reveal the real-world trade-offs people make.
Smart tip: Ranking data is ordinal. That means you cannot legitimately calculate a mean rating from ranking responses the way you can with a likert scale question. Averaging ranks is one of the most common analytical mistakes in survey research.
When to use ranking query (and when not to)
Use them when:
- You want to know what people truly value most, not just what they like.
- You want people to choose between options, the way they would in real life.
- You’re comparing a clear set of similar options.
- You want to avoid everyone giving the same answer or rating everything equally.
- You’re trying to prioritize features, understand preferences, or evaluate options.
Avoid them when:
- You want to know how much someone values something; use a rating scale instead.
- Your list has more than 7–10 items. Too many choices make it hard to answer, and the middle rankings become less reliable.
- The options are too different from each other to fairly compare (for example, asking people to rank “team culture” against “year-end bonus”).
- Some people may not be familiar with all the options. If so, always add a “does not apply” choice.
- You need exact, measurable data for analysis. A rank order scale only tells you the order, not the distance between choices.
5 types of ranking queries
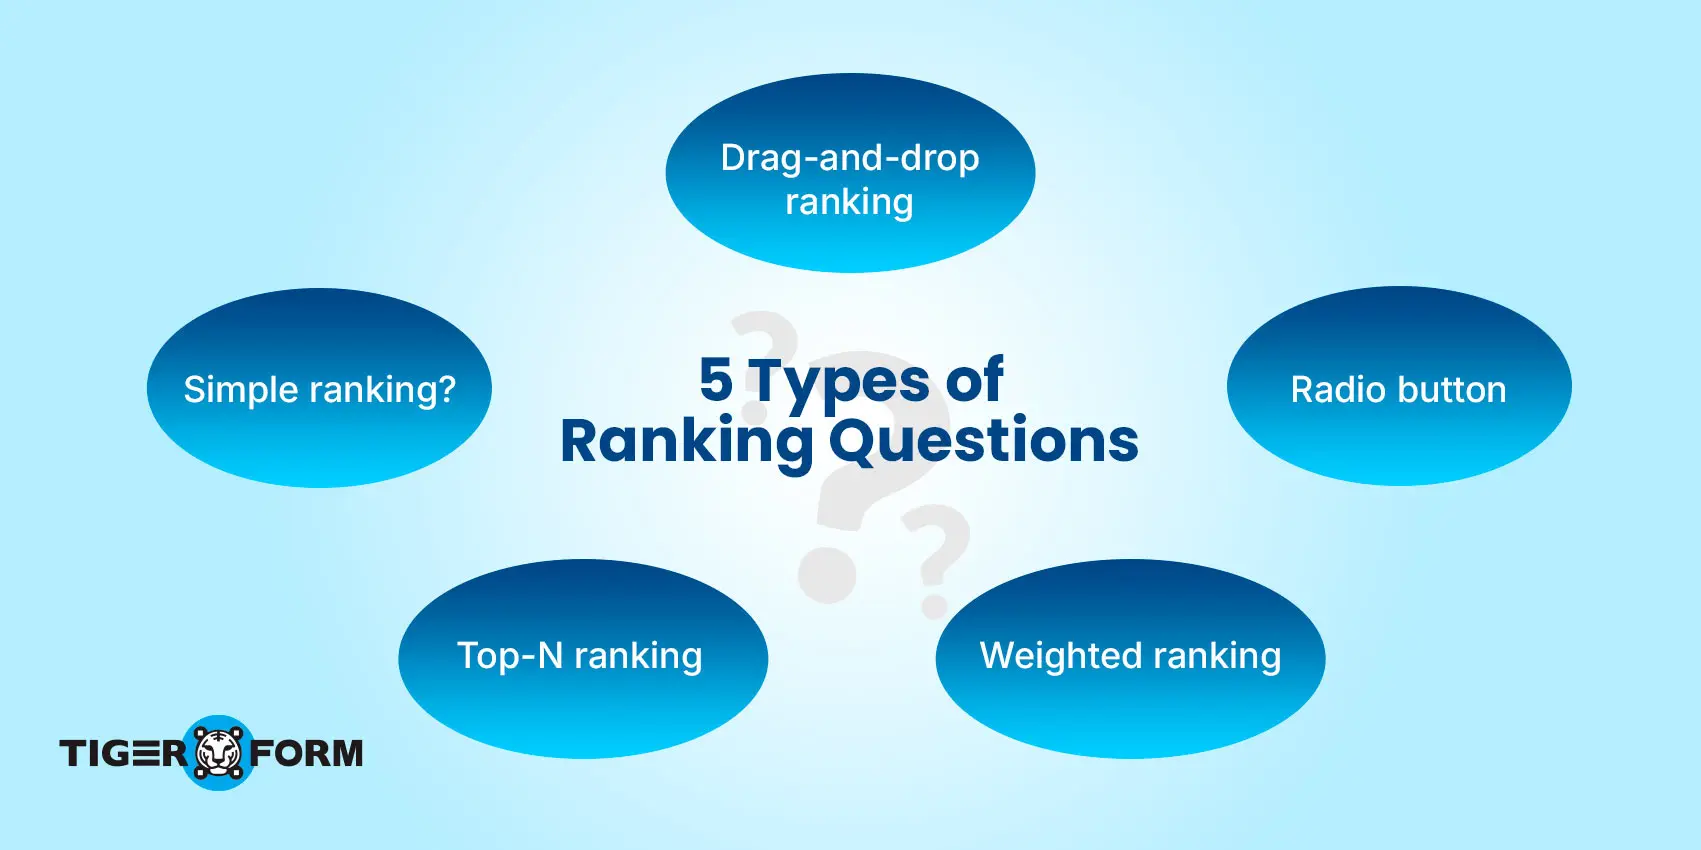
1. Simple ranking (ordered list)
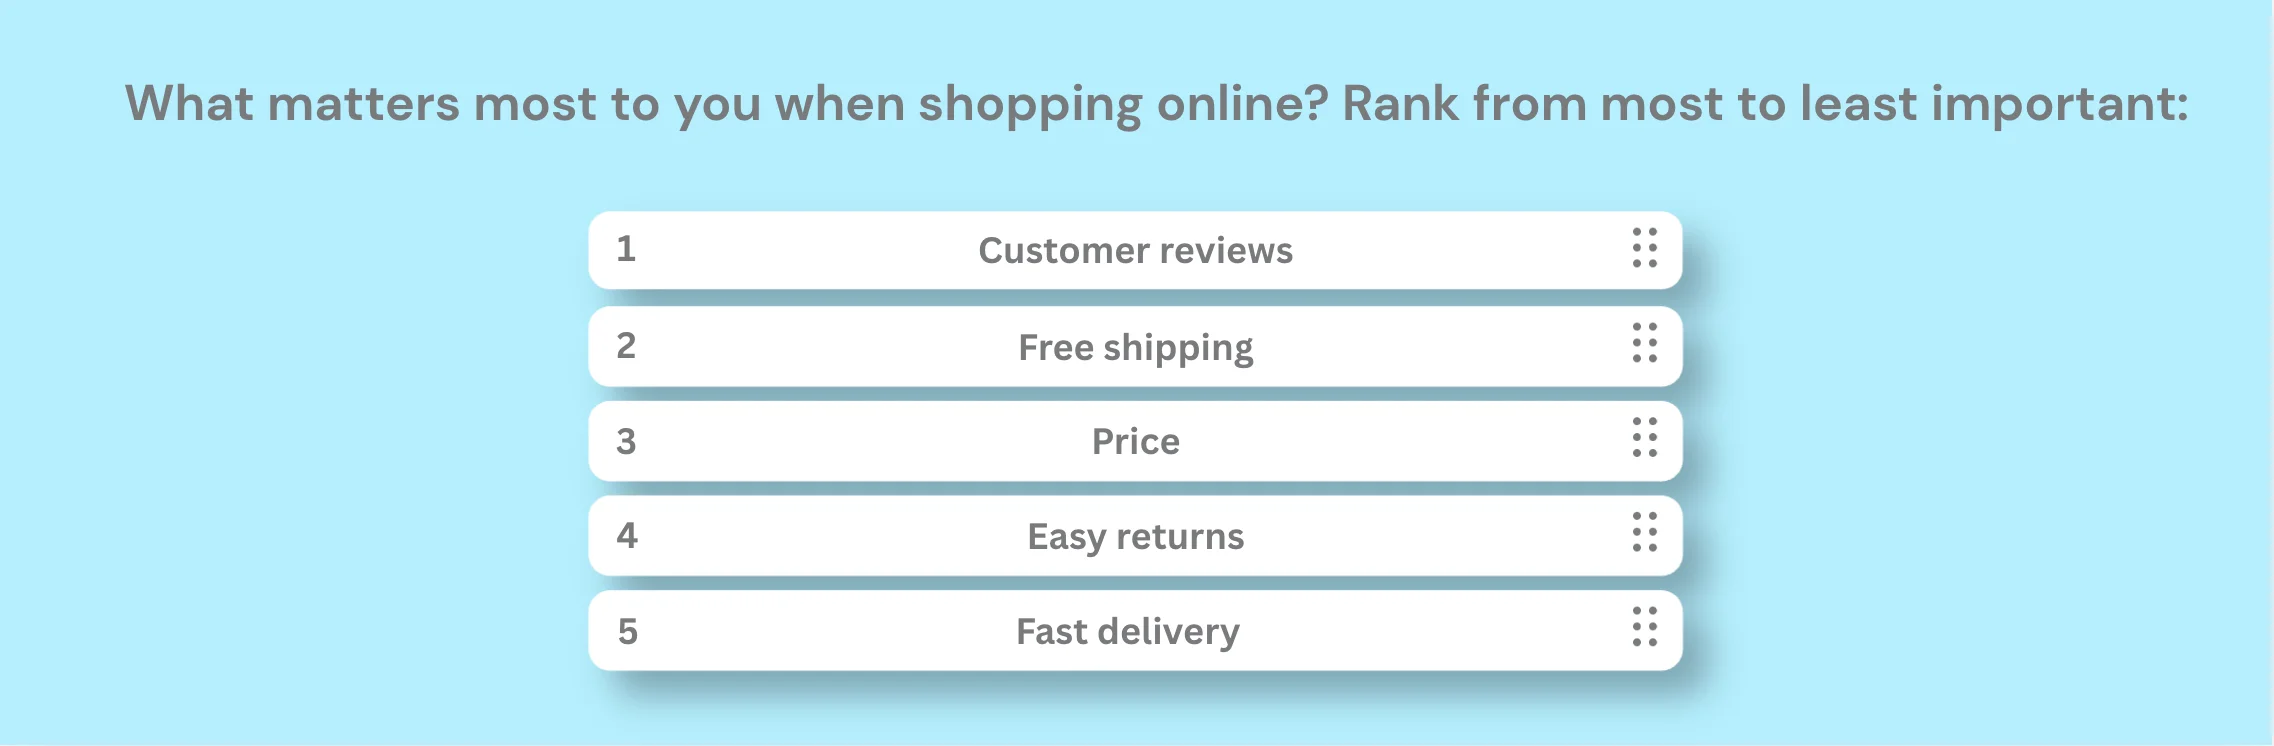
A simple ranking will have respondents assign a number (1, 2, or 3) to each item on the list. It’s the most straightforward format and works best for short lists of five to seven items.
Limitation: Beyond seven items, simple ranking becomes unreliable. Respondents start guessing in the middle positions rather than thinking carefully, so keep your lists tight.
2. Drag-and-drop ranking
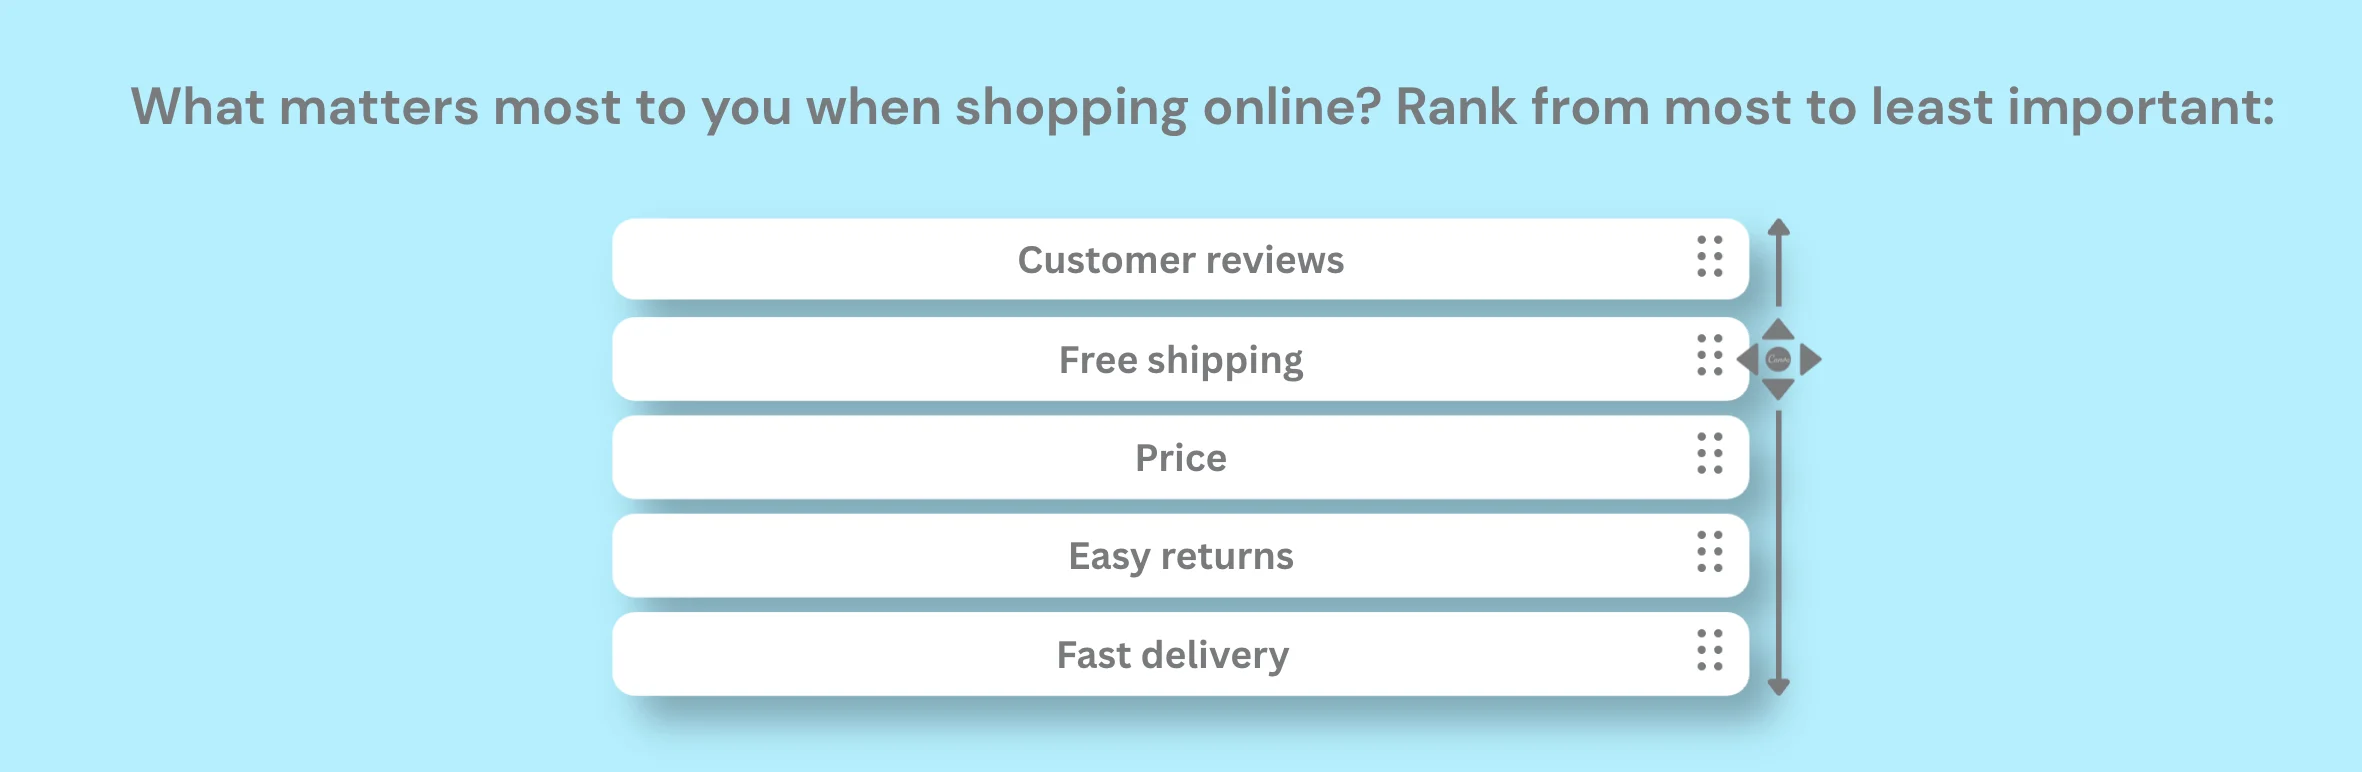
This interactive ranking asks respondents to reorder items by on-touch dragging the choices by their preferred sequence. This format feels intuitive and keeps the digital survey engaging.
Drag-and-drop formats show higher engagement on desktop but can frustrate mobile users. Test on both. Some platforms substitute swipe gestures or arrow buttons for touchscreens. Always check how your ranking query behaves on the actual devices your audience uses.
Smart tip: Drag-and-drop interactions feel natural on desktop but can be finicky on touchscreens. Test on both desktop and mobile and adjust them accordingly. Some platforms substitute swipe gestures or arrow buttons for mobile.
3. Radio button/matrix ranking
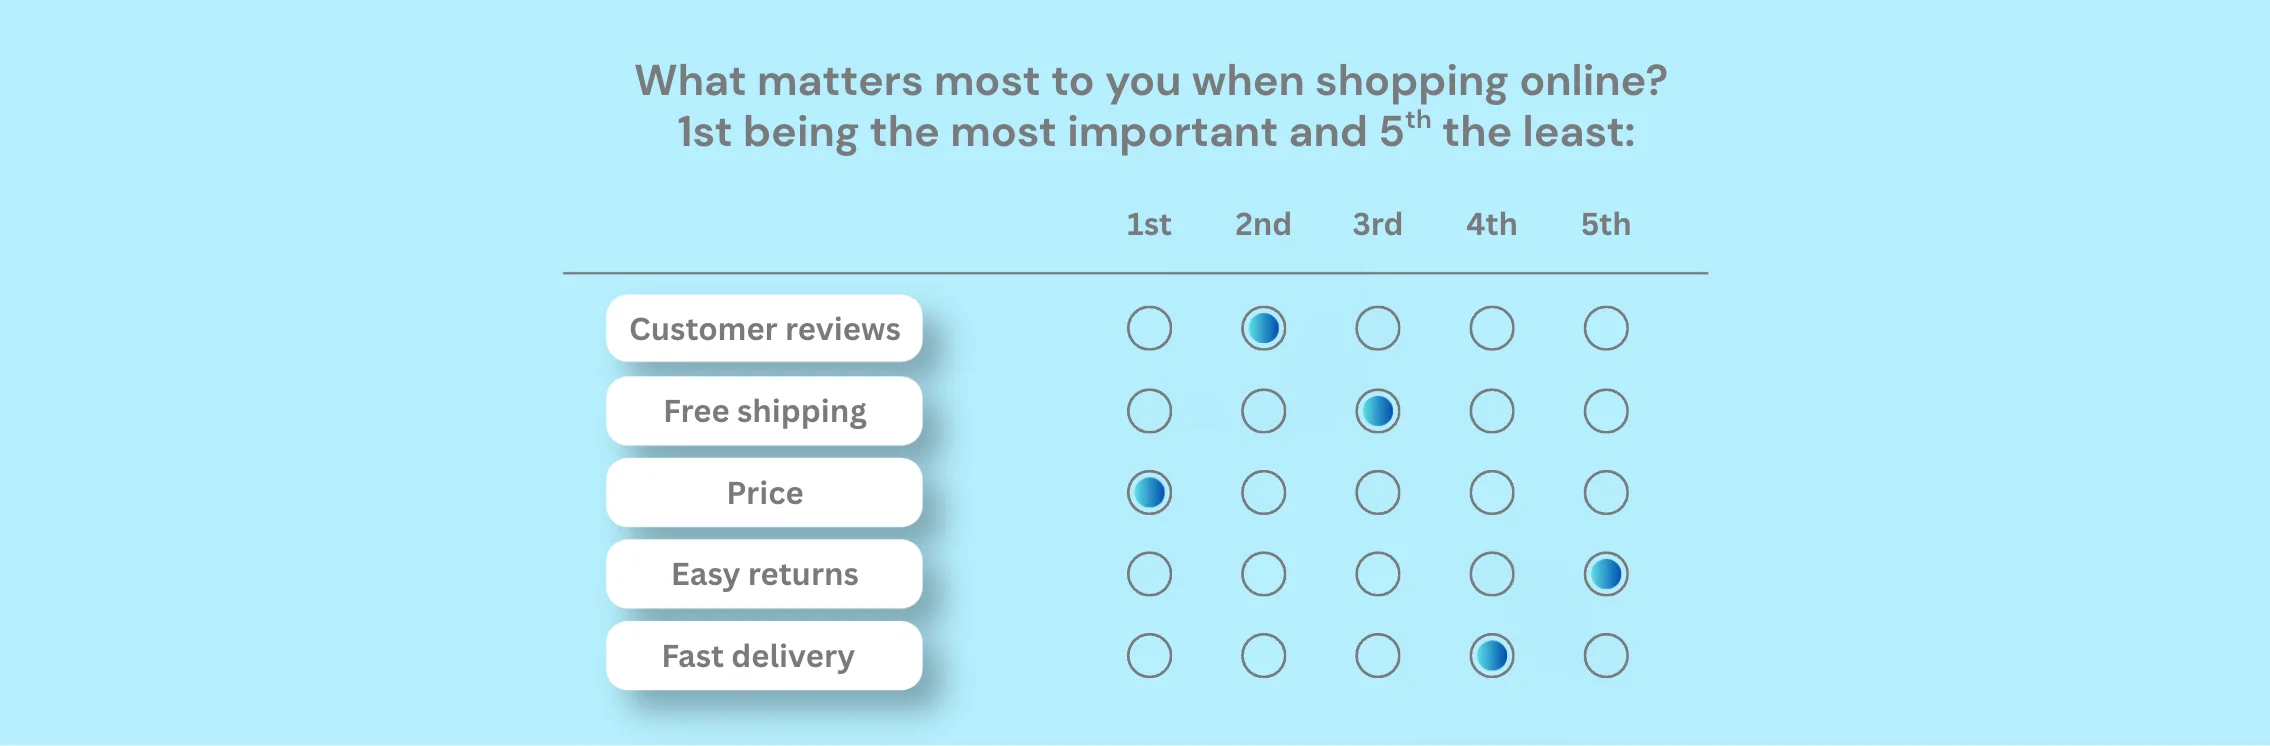
This type shows a grid where respondents select a rank number from a dropdown or radio set for each item. This format doesn’t require drag-and-drop functionality, making it more accessible and easier to use on older devices.
Limitation: respondents can accidentally assign the same rank to two items. Your survey ranking tool must validate for this; if not, your data becomes faulty and unusable.
4. Top-N ranking (partial ranking)
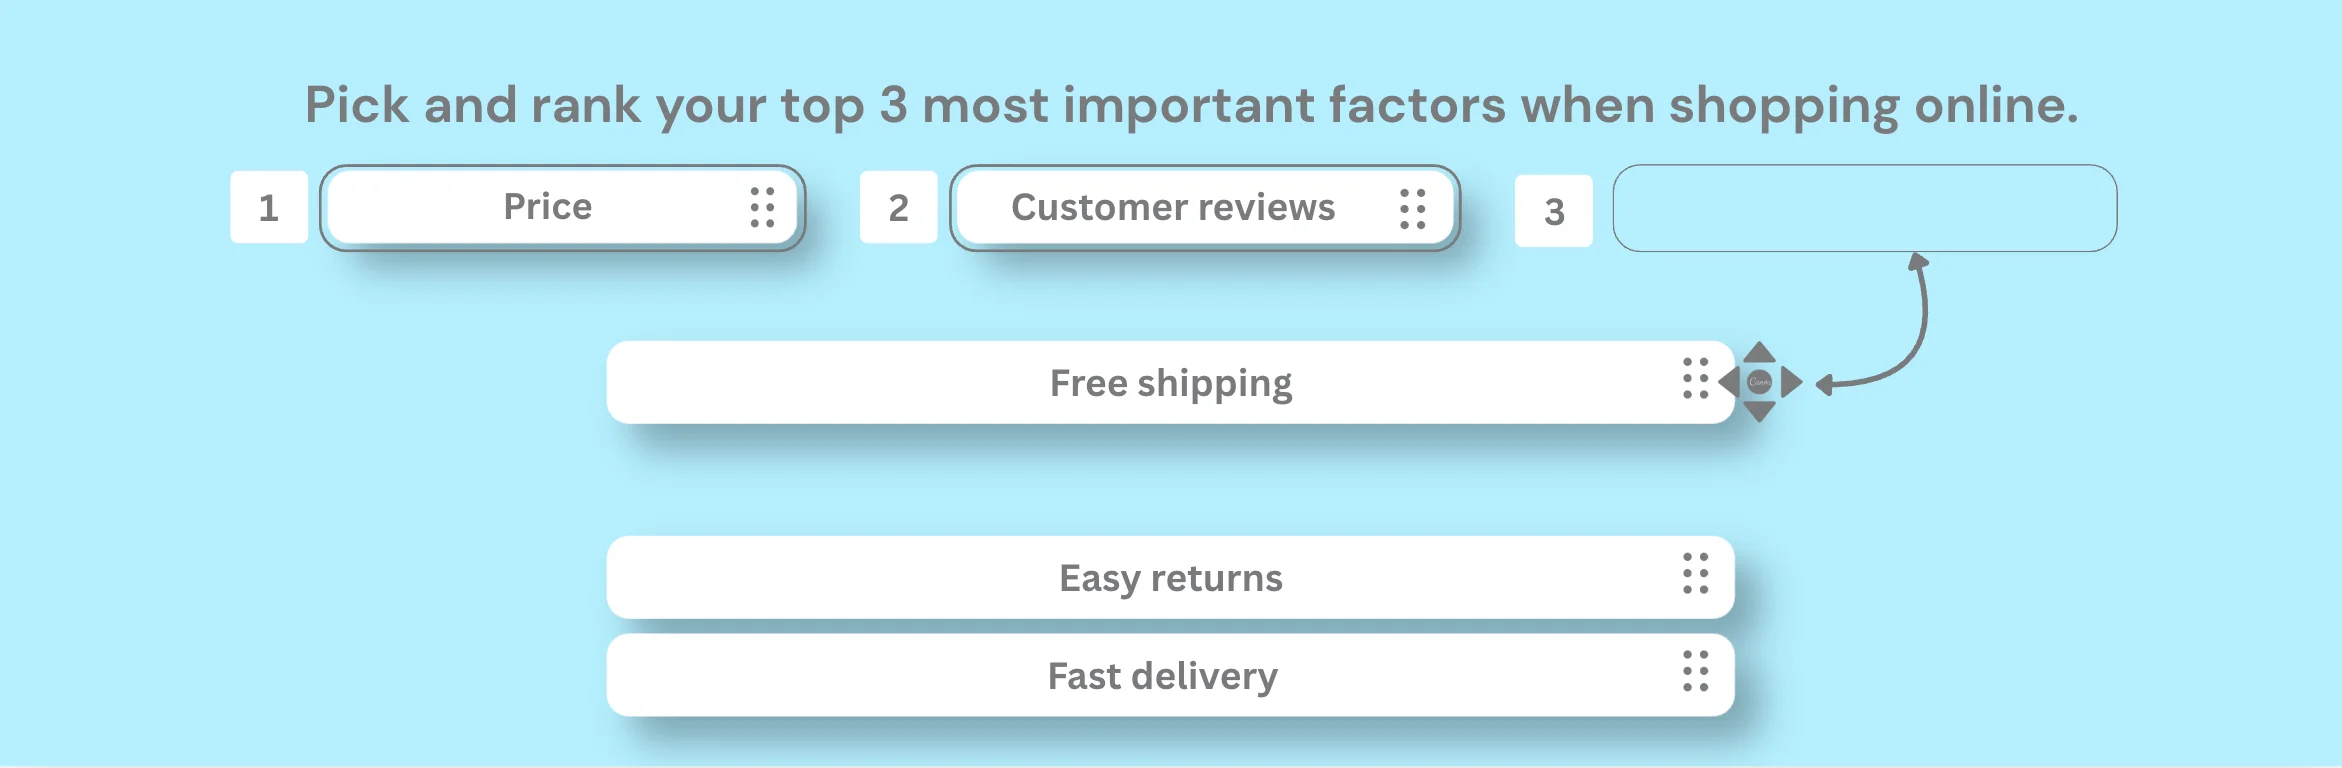
This type doesn’t ask people to rank everything. Respondents only rank their top N choices, where N depends on how many top choices the question calls for. For example, you might ask respondents to pick and rank their top three from a list of ten.
This format dramatically reduces cognitive load and dropout rates when your list is long. You lose data on lower-ranked items. But if you only need to know the strongest preferences, that’s a worthwhile trade.
5. Weighted ranking (point allocation / constant sum)
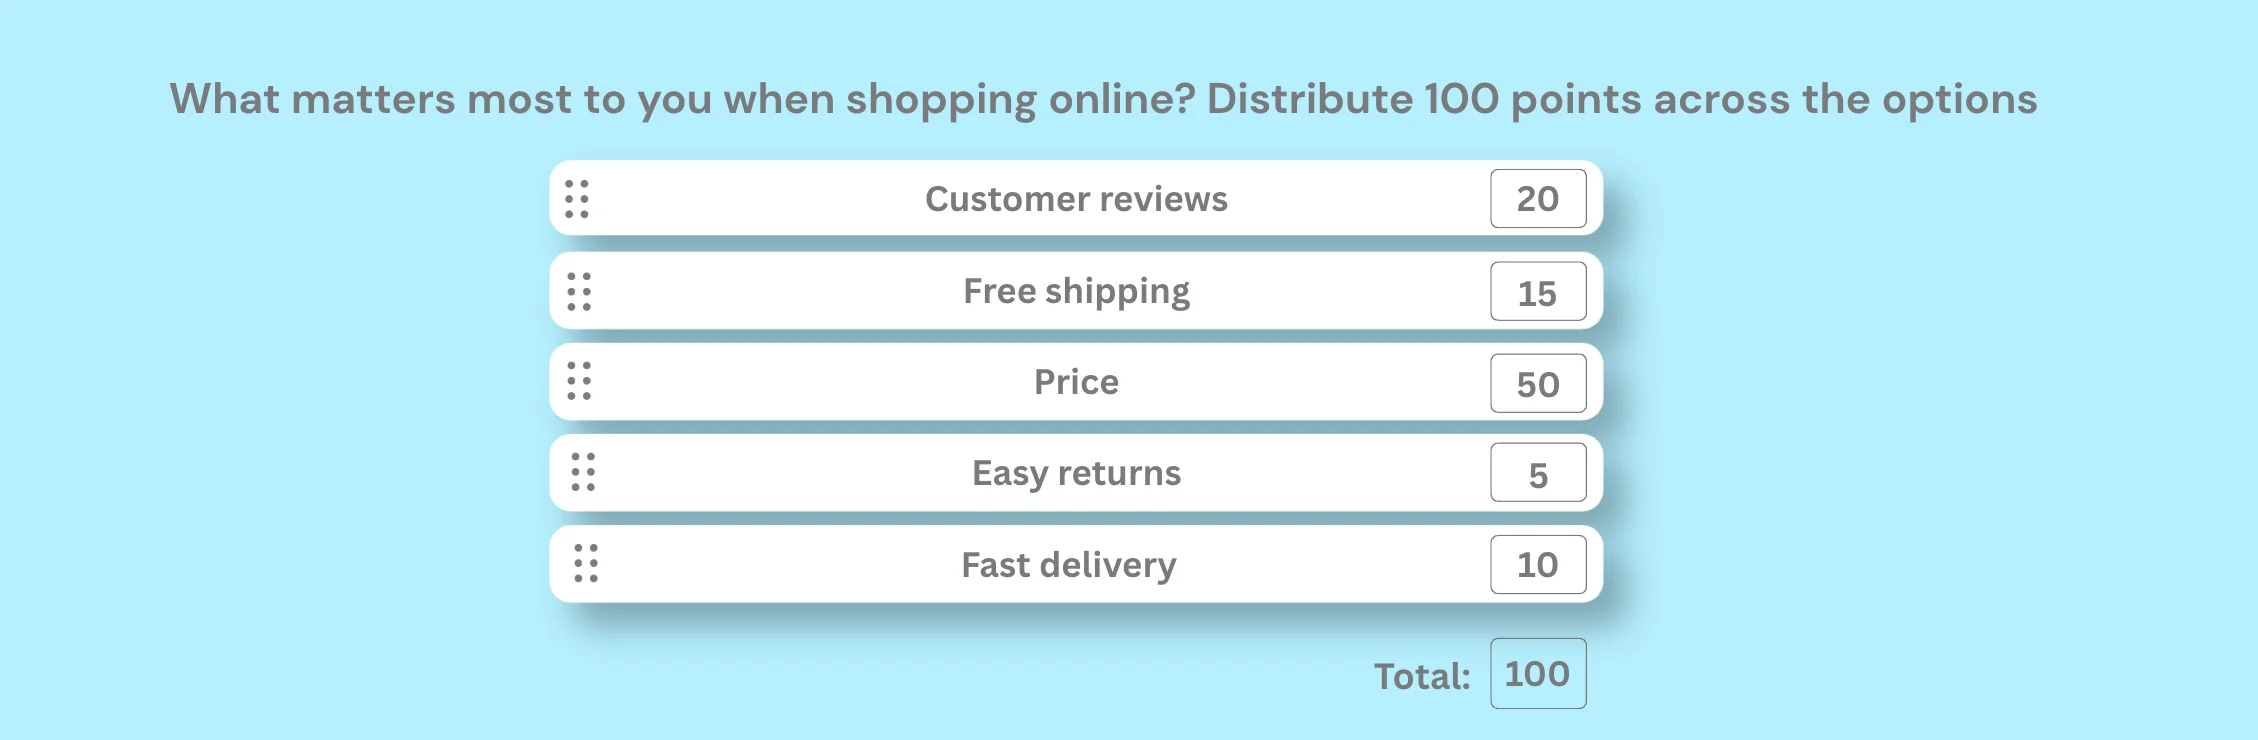
Respondents receive a fixed total number of points, say 100, and distribute them across options based on importance. This reveals not only order but also the intensity of preference.
This is the most powerful format for product trade-off research and budget allocation studies. It’s also the most cognitively demanding, so use it sparingly and only when the degree of preference matters as much as the rank itself.
Special mention: Pairwise Comparison
Also called forced-choice ranking, this method presents two items at a time. Respondents choose between them repeatedly until a full hierarchy emerges.
It works brilliantly for items with close perceived value where a simple list won’t reveal meaningful differences. It requires advanced survey tools, but the data quality is exceptional.

How to create ranking surveys with TIGER FORM
1. Sign up
Log in to your TIGER FORM account. If new, sign up for free in under a minute. Once you’re in, you can start creating.
2. Start with a template, an AI form builder, or from scratch
2a. To start from scratch, go to the “Form” tab and build your ranking survey from zero.
2b. You can also start creating the form through an AI form generator, where you use prompts to command AI in drafting a complete but customizable form.
2c. Also, you can use a form template for convenience. Since the template is customizable, you can modify the form according to your preference or branding.
3. Add your survey title and questions
TIGER FORM supports multiple field types. Use the ranking or drag-and-drop field to add your questions, and let respondents order their choices directly on-screen.
4. Customize the design and finalize
Adjust fonts, colors, and layout so your survey looks like it belongs to your brand, not like a generic form. You can add your logo or watermarks to white-label the form. After that, preview the form to make small tweaks and finalize it.
5. Generate your QR Code
Being a QR-focused form tool, TIGER FORM has a built-in QR code generator in its form builder. Once your ranking survey is ready, go to the publish settings and generate a QR code directly tied to your survey link. Respondents scan, rank, and submit—all from their phones, no lengthy links required.
6. Share the QR code
After generating the QR code, download it as an image file. You can print the file digitally or print it in your conference materials and embed it on websites/social media posts.
7. Track responses and analyze results
Once your survey is live, monitor results in real time from your dashboard. You can:
– View individual responses as they come in
– See visual charts showing how items were ranked across all respondents
– Export the submissions to the Sheets software.
You can use these materials to analyze your survey problem and find a solution.
Ranking queries examples by use case
Customer experience
1. What matters most when you shop with us? Put these in order:
☰ Product quality
☰ Customer service
☰ How fast does it arrive
☰ Price
☰ How easy it is to return something
2. Rank what makes good customer service to you:
☰ Being friendly
☰ Being quick
☰ Actually fixing your problem.
☰ Being available
☰ Treating you personally
Product development
3. Which features do you think we need to deploy? Rank them in order:
☰ Dark mode
☰ Offline editing
☰ AI chatbots
☰ Custom notification
☰ Translation
4. Rank what you look for when buying skincare:
☰ What’s in it
☰ Does it work
☰ How it looks
☰ Price
☰ Good for the environment
Market research and branding
5. Where do you usually discover new products? Rank from most to least likely:
☰ Instagram
☰ TikTok
☰ Pinterest
☰ YouTube
☰ Facebook
6. What would most convince you to try a new brand? Put these in order:
☰ A friend’s suggestion
☰ Social media ad
☰ Influencer review
☰ TV commercial
☰ Email offer
HR and employee engagement
7. What would make you stay at a job longer? Rank these:
☰ Pay
☰ Good leadership
☰ Time for yourself
☰ Team vibe
☰ Chances to move up
8. Rank which of these would most help you get more done at work:
☰ Upgraded tools
☰ Planned goals
☰ More freedom
☰ Fewer meetings
☰ A quieter space
Education
9. Which study methods work best for you? Put them in order:
☰ Practice tests
☰ Taking notes
☰ Studying with others
☰ Flashcards
☰ Reading again
10. How do you prefer to take a course? Order these:
☰ Live classes
☰ Recorded videos
☰ Hands-on practice
☰ Reading materials
☰ Podcasts
Travel and Hospitality
11. What matters most when picking a hotel? Put these in order:
☰ Price
☰ Where it is
☰ Reviews
☰ What it offers
☰ Loyalty points
12. Order these types of trips from most to least appealing to you:
☰ Exploring a city
☰ Relaxing on the beach
☰ Adventure activities
☰ Learning about local culture
☰ Trying local food
Healthcare
13. What do you look for when choosing a doctor or clinic? Put these in order:
☰ How close it is
☰ Cost
☰ Wait time
☰ Doctor’s reputation
☰ Being able to book online
14. Rank the healthy habits that are most part of your daily life:
☰ Sleep
☰ Exercise
☰ Eating well
☰ Managing stress
☰ Spending time with people
Events and Conferences
15. What did you find most valuable today? Order these from most to least:
☰ Main speakers
☰ Meeting new people
☰ Workshops
☰ Exhibition area
☰ Joining online
16. Which event format do you prefer? Put these in order:
☰ In person
☰ Fully online
☰ Mix of both
☰ Watch it later
☰ Small group discussion
Retail and E-commerce
17. What most influences when you buy online? Order these:
☰ Reviews from others
☰ Price
☰ Free shipping
☰ Knowing the brand
☰ Easy returns
18. Rank the payment features that matter most to you:
☰ Safe transactions
☰ Low fees
☰ Fast transfers
☰ Easy to use
☰ Help available anytime
Best practices for writing ranking questions
Do’s:
1. Keep your list to 5–7 items
Beyond seven, respondents stop thinking carefully and start filling in blanks. The top and bottom positions stay reliable. The middle falls apart.
A hotel chain once sent a ranking question with 12 amenity options. The top three and bottom three results were clear. Everything in between was statistically noise. They redesigned the question as two separate 6-item lists and finally got usable data.
2. Use specific, mutually exclusive options.
If two items are too similar, “fast shipping” and “quick delivery,” respondents can’t differentiate them. Your data will reflect their confusion, not their preferences. Every item on your brand survey should be clearly distinct.
3. State the ranking direction explicitly.
Tell respondents whether 1 means “most important” or “least important.” Don’t assume they’ll know. Different survey platforms default differently. Put the instruction directly in the question text, not buried in the general guidance above.
4. Add an N/A option when needed.
If any respondent might be unfamiliar with an item on your list, give them an out. Forcing someone to rank something they’ve never heard of pushes it to the bottom. Not because of preference, but because of ignorance, and that will skew your data’s value.
Don’ts
1. Do not use more than 10 items.
Long lists cause satisficing. Respondents give any acceptable answer instead of their genuine best answer. A 15-item ranking survey is a reliable way to collect 15 responses that don’t reflect reality.
2. Do not rank items that can’t be meaningfully compared
Asking someone to rank “office location,” “CEO reputation,” and “quarterly bonus” produces an ordering that means nothing. Items need to operate on the same scale to be ranked against each other.
3. Average your ranking data
This is the most common mistake, and it’s a serious one. Ranking produces ordinal data. The difference from Rank 1 to Rank 2 is not the same as the gap between Rank 4 and Rank 5. Use median ranks, Borda counts, and frequency distributions. Never means.
How to analyze ranking survey data
1. Mean rank calculation
Assign each rank a number (1 = first, N = last) and calculate the average rank per item. Lower average means higher collective preference. This method is fast and directional, but treats ordinal data as interval data, so use it for quick reads, not precision.
2. Weighted scoring (Borda count)
Reverse-score each rank. With 5 items, first place gets 5 points, second gets 4, and so on. Total the points per item. The highest score wins. More robust than mean rank because it accounts for the magnitude of preference, not just position.
3. Frequency distribution
Count how many times each item appeared at each rank position. Visualize as a stacked bar chart. This is where the real insight lives.
If “Price” is ranked first by 60% of respondents but last by 30%, that tells a completely different story than “Price” sitting at a consistent rank 2 across the board, even if the average rank looks similar.
4. Segmentation analysis
Break your rankings down by respondent group: age, location, customer tier, product usage. Priority rankings almost always look different across segments.
A feature that tops the list for enterprise users may rank last for small business customers. This is where ranking data becomes genuinely actionable.
5. Visualizing ranking data
Choose your visualization carefully. These formats work well for ranking data:
- Stacked bar charts – frequency of each rank per item
- Heat maps – rank distribution at a glance
- Dot plots / rank-order plots – mean rank with confidence intervals
Smart tip: Avoid pie charts as they are not suited to ordinal ranking data.

Build your first ranking survey with TIGER FORM
Most survey questions collect opinions. Ranking questions collect priorities, and those priorities are rarely the same.
When you design your next survey, ask yourself whether you want to know how people feel or what they would actually choose. If it’s the latter, ranking queries are your answer.
We hope this guide has become your starting point for learning deeply about ranking surveys, their types, some examples, and how to create them. Create your ranking surveys with TIGER FORM now!
FAQs
How many items should I include in a ranking query?
5 to 7 items is usually the ideal range. Once question items exceed, rankings become less accurate. For longer lists that are unavoidable, ask respondents to rank only their top 3–5 choices, or split the items into smaller groups.
Can ranking queries cause survey fatigue?
Yes, especially when the list is long or several ranking queries appear back-to-back. Keep lists short (5–7 items) and use interactive formats (like drag-and-drop) to retain users’ attention.
Are ranking queries suitable for mobile surveys?
Yes, as long as they’re mobile-friendly. Drag-and-drop can feel awkward on small screens, so arrow buttons or swipe-based ranking work better. It also helps to keep the list short or ask users to rank only their top choices.