
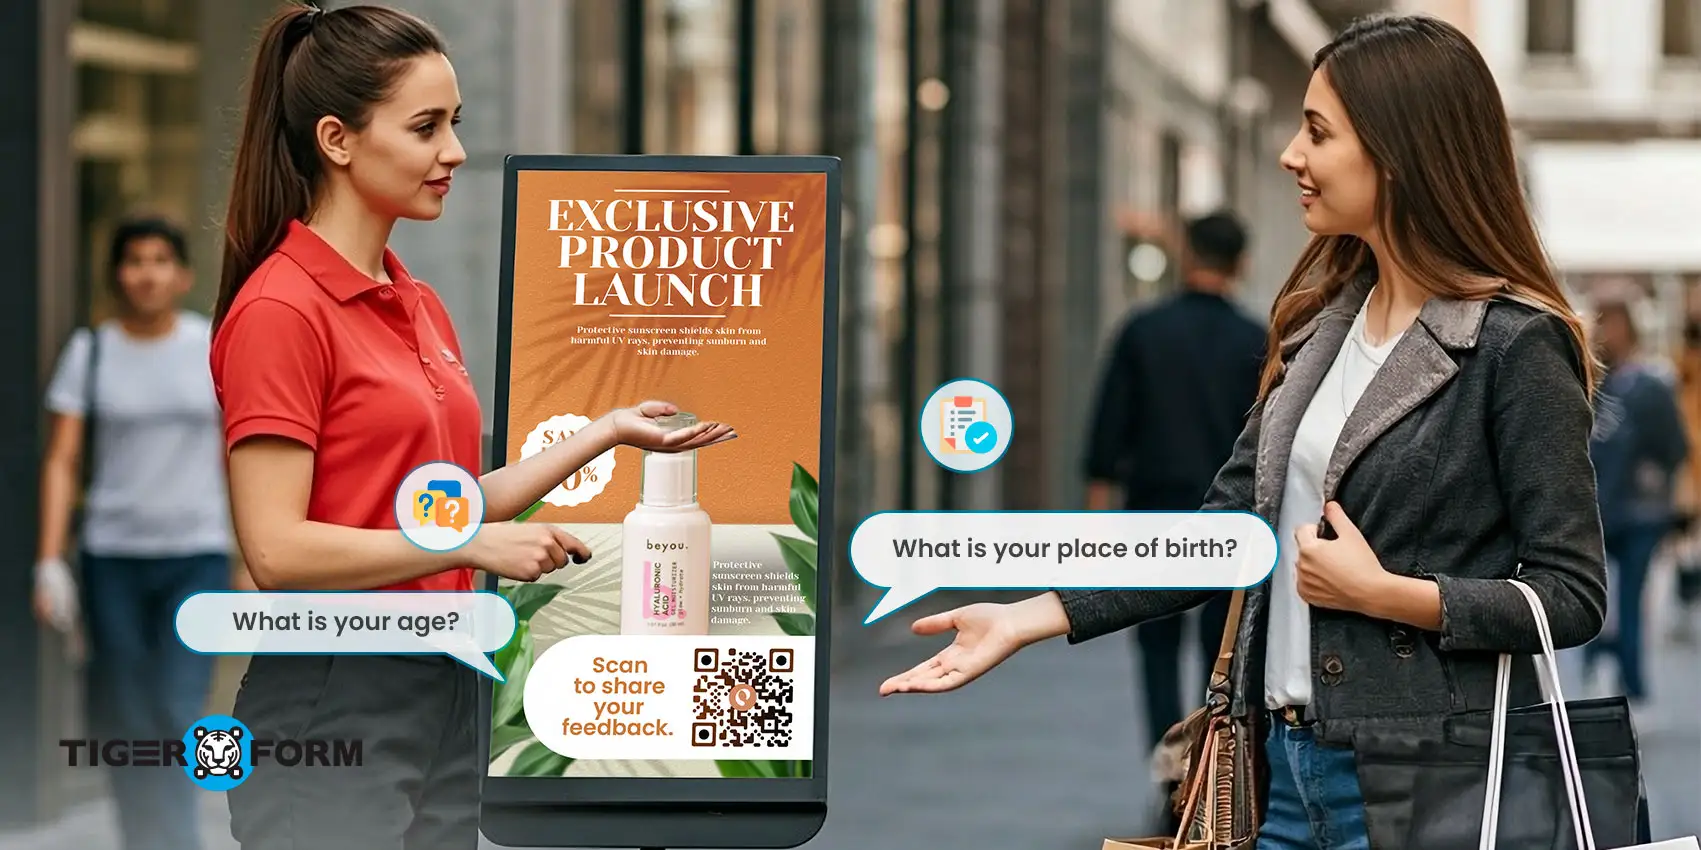
Choosing the right demographic survey questions can make the difference between collecting basic responses and gaining meaningful insights. Demographic survey questions uncover trends, segment responses, and allow for meaningful comparisons across age groups, income brackets, education level, and more.
In fact, surveys that include demographic filters often yield insights up to 30% more actionable than those without them, according to industry benchmarks.
In this guide, you’ll learn what demographic survey questions are, why they’re important, and discover 20 demographic survey question examples you can use in your next survey. We’ll also share best practices and common mistakes to avoid for collecting demographic data respectfully and accurately.
What are demographics?
Demographics are the statistical data that describe the composition of human populations. They help us understand who people are at a basic social level. Using demographic questions as part of your data collection method helps confirm you’re gathering the right insights from the right people.
In essence, demographics provide a snapshot of the structure of a targeted population based on specific measurable characteristics. These aren’t personal opinions, beliefs, or behaviors but stable traits that can be observed, recorded, and compared. According to the Pew Research Center, demographic information remains one of the most important tools for analyzing survey results because it allows researchers to compare responses across different population groups.
For example, if you’re launching a new mobile app, demographic data may show that users between 18 and 34 prefer mobile payments, while older users are more interested in security features. Likewise, an online retailer may discover that customers in urban areas shop more frequently than those in rural locations.
Demographic survey questions are commonly used in:
- Customer satisfaction surveys
- Market research
- Employee engagement surveys
- Healthcare research
- Education surveys
- Government studies
- Community development projects
Why are demographic survey questions important?
Adding demographic survey questions helps you understand not just what people think, but who is sharing those opinions. This allows you to identify patterns, compare different audience segments, and create products, services, or campaigns that better meet people’s needs.
Here are some of the biggest benefits.
1. Planning and using resources wisely
Governments and organizations use demographics to plan community projects. For example, knowing the average age of a population can reveal whether there’s a greater need for newborn facilities, healthcare centers, or senior services.
2. Customer research and business strategy
Businesses use demographics to understand who their customers are and how to market products to them. The data gathered also allows companies to personalize products, advertising, and distribution channels.
3. Policy making and governance
Demographic data influences everything from voting districts to public policy decisions. Understanding population makeup helps governments respond to needs, promote fairness, and plan for the future.
4. Fairness and inclusion
Demographic analysis can reveal patterns of inequality in education, healthcare, and employment. Comparing graduation rates by ethnicity or income can highlight systemic gaps that need attention.
5. Social science and research
Demographics help researchers understand patterns in behavior, attitudes, and outcomes in academic and scientific contexts.

20 demographic survey questions (With Examples)
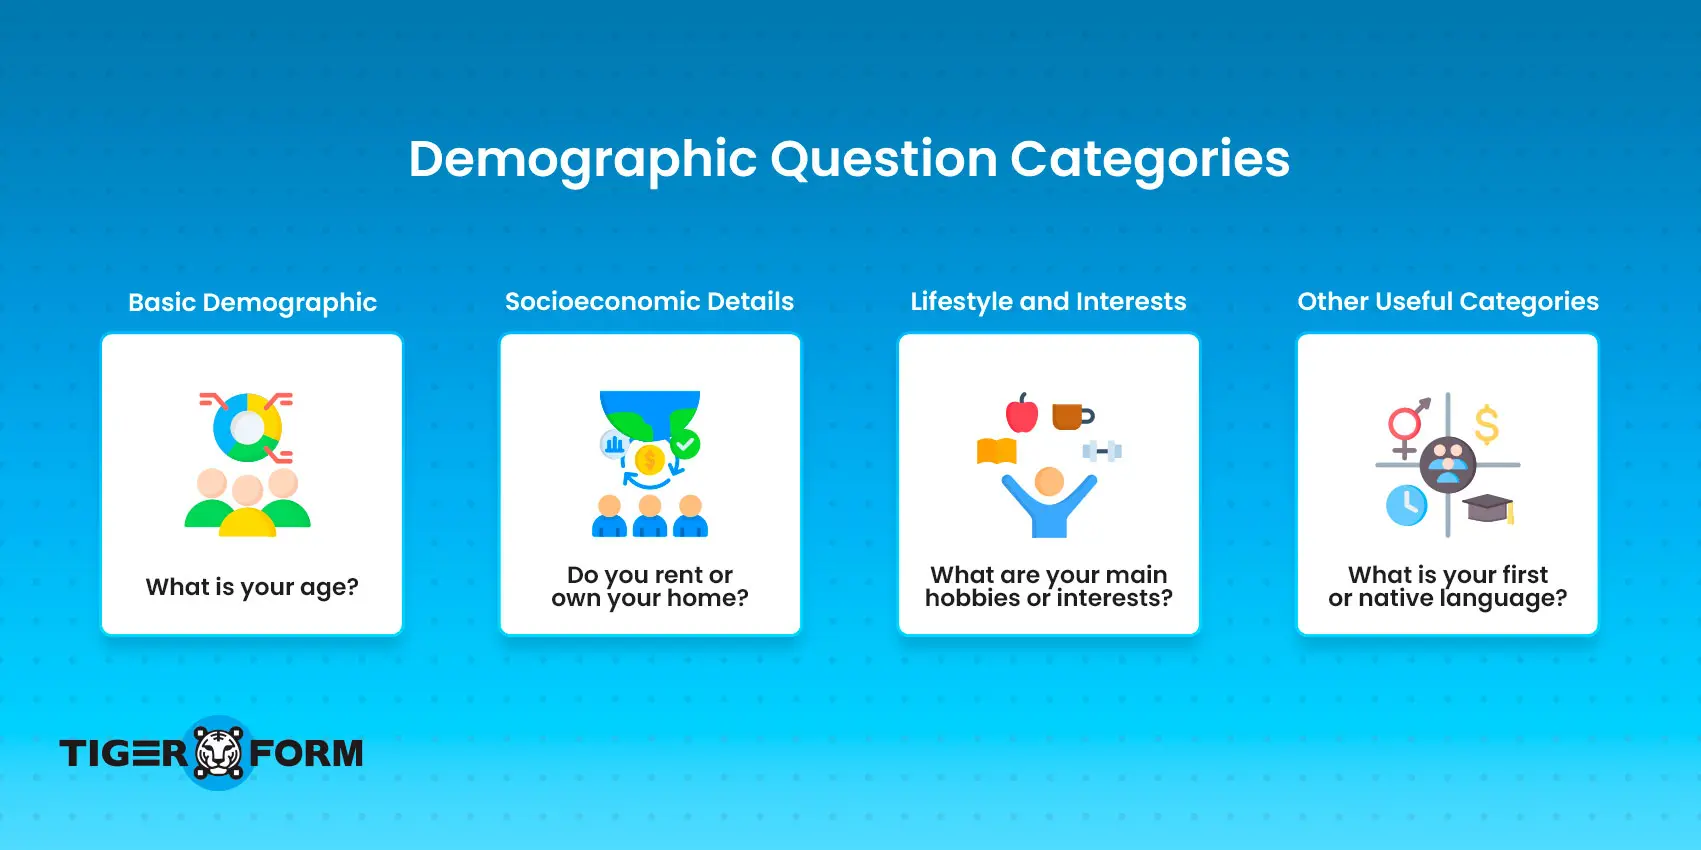
Not every survey needs every demographic question. The best approach is to ask only the questions that support your research goals. Keeping demographic sections short and relevant also improves completion rates.
Below are 20 commonly used demographic questions for a survey, organized into easy-to-understand categories.
Basic demographic survey questions (with examples)
This category includes foundational information about your respondents. It’s the go-to variable in almost every demographic survey because it helps build a broad but essential profile of people.
Basic demographics are often the first filters for understanding a target audience. Whether you’re analyzing social trends or running a public policy survey, these details also serve as essential cross-tabulation points in most data analysis.
| Demographic Category | Example Question(s) | Recommended Answer Format |
| 1. Age | • What is your age? • Which age group do you belong to? • What is your year of birth? (Only if precise age is required.) | Multiple Choice (Recommended): • Under 18 • 18–24 • 25–34 • 35–44 • 45–54 • 55–64 • 65+ |
| 2. Gender | • What is your gender? • Which of the following best describes your gender identity? | Multiple Choice: • Male • Female • Non-binary • Prefer to self-describe • Prefer not to answer |
| 3. Relationship Status | • What is your current relationship status? • Which best describes your marital status? | Multiple Choice: • Single• Married • Living with a partner • Divorced • Widowed • Prefer not to answer |
| 4. Race or Ethnicity | • What is your race or ethnicity? • How would you describe your ethnic background? • Do you identify with more than one ethnicity? | Checkboxes or Multiple Choice: Include categories relevant to your audience, plus: • Prefer to self-describe • Prefer not to answer |
| 5. Location | • Where do you currently live? • Which country do you reside in? • What is your state, province, or region? • What is your ZIP or postal code? | Dropdown or Short Answer: Country → State/Province → City → ZIP/Postal Code (as needed) |
Socioeconomic demographic survey questions
This set of demographic questions helps paint a picture of a person’s financial and social position. Socioeconomic data drives segmentation strategies, pricing models, educational initiatives, and more.
If you’re trying to understand market behavior or policy impact, you need to know not just who people are, but how they live. For example, you need to note when analyzing socioeconomic demographics that:
- Income doesn’t always predict purchasing power. Sometimes, household size and regional cost of living also influence spending behavior.
- Education level may correlate with specific lifestyle preferences or openness to innovation.
- Employment status can be fluid and should be treated with nuance.
| Demographic Category | Example Question(s) | Recommended Answer Format |
| 6. Household Income | • What is your annual household income before taxes? • Which income range best describes your household? • What is your approximate monthly household income? | Multiple Choice (Income Ranges): • Less than $25,000 • $25,000–$49,999 • $50,000–$74,999 • $75,000–$99,999 • $100,000+ • Prefer not to answer |
| 7. Education Level | • What is the highest level of education you have completed? • What is your highest educational qualification? | Dropdown or Multiple Choice: • High school or equivalent • Diploma/Certificate • Associate degree • Bachelor’s degree • Master’s degree • Doctorate • Other |
| 8. Employment Status | • What is your current employment status? • Which best describes your work situation? | Multiple Choice: • Full-time • Part-time • Self-employed • Student • Retired • Unemployed • Other |
| 9. Occupation | • What is your current occupation? • What is your job title? • Which industry do you work in? | Short Answer or Dropdown (if targeting specific industries) |
| 10. Household Size | • How many people live in your household? • Including yourself, how many people currently live at your primary residence? | Dropdown:1, 2, 3, 4, 5, 6+ |
| 11. Homeownership | • Do you own or rent your home? • Which best describes your housing situation? | Multiple Choice: • Own • Rent • Live with family/friends • Employer-provided housing • Other |
Lifestyle demographic survey question examples
This is the more qualitative, behavioral side of demographic information. Lifestyle segmentation helps brands tell more compelling stories and craft highly relevant experiences. It’s where demographics meet psychographics; if basic demographics tell you who, lifestyle tells you how they live.
Trends in tech adoption, sustainability values, or wellness routines often cross age or income lines. Someone in their 60s may adopt wearable health tech faster than younger people if they value health tracking. It’s also helpful to measure consistency (is this a core lifestyle or a passing interest?).
| Demographic Category | Example Question(s) | Recommended Answer Format |
| 12. Hobbies and Interests | • What are your main hobbies or interests? • Which activities do you enjoy in your free time? • Select the hobbies you regularly participate in. | Checkboxes: • Reading • Fitness • Traveling • Gaming • Cooking • Music • Sports • Other |
| 13. Purchasing Behavior | • How often do you shop online? • What factors influence your purchasing decisions? • Where do you usually shop for products? | Multiple Choice or Checkboxes: • Price • Quality • Brand Reputation • Customer Reviews • Recommendations • Discounts • Sustainability |
| 14. Health and Wellness | • How often do you exercise each week? • Do you follow a specific diet or wellness routine? • How would you describe your overall health? | Multiple Choice: • Frequency options (Daily, Weekly, Occasionally, Never) or Yes/No |
| 15. Technology Usage | • Which device do you use most often? • How many hours do you spend online each day? • Which social media platforms do you use regularly? | Multiple Choice or Checkboxes: • Smartphone • Laptop • Desktop • Tablet • Smartwatch • Other |
Other useful demographic survey questions
This category captures essential yet often overlooked data points: disability status, military service, language, religion, and citizenship. These provide context that can significantly impact someone’s experiences, access, or preferences.
These identifiers offer critical insights into accessibility needs, cultural norms, and legal eligibility. For example, knowing respondents’ veteran status can influence how you shape support services, or knowing someone’s primary language can guide your targeted messaging or platform choice.
What you might not know:
- Disability status is broad. It can include physical, cognitive, emotional, or even temporary impairments.
- Language preference isn’t just about communication; it’s tied to cultural nuance.
- And religion affects more than belief. It can also influence diet, holidays, clothing, and daily routines.
| Demographic Category | Example Question(s) | Recommended Answer Format |
| 16. Disability Status | • Do you identify as a person with a disability? • Do you require any accessibility accommodations? | Multiple Choice: • Yes • No • Prefer not to answer |
| 17. Veteran or Military Status | • Have you served in the military? • Are you a veteran? | Multiple Choice: • Yes • No • Prefer not to answer |
| 18. Citizenship or Nationality | • What is your country of citizenship? • What is your nationality? • Which country are you a citizen of? | Dropdown (Country List) or Short Answer |
| 19. Religion | • What is your religious affiliation? • Do you identify with a particular religion or faith? | Multiple Choice: List religions relevant to your audience, plus: • Prefer to self-describe • Prefer not to answer |
| 20. Primary Language | • What is your primary language? • Which language do you speak most often at home? • What language would you prefer for communication? | Dropdown or Short Answer |
Challenges in using demographic survey questions
1. Some demographic questions are sensitive
Some demographic survey questions can touch on deeply personal parts of someone’s identity and may lead to sensitivity or exclusion.
This often happens when respondents don’t understand why the information is being collected or how it will be protected. If the questions are not handled thoughtfully, people may skip or abandon the survey.
2. Categories may not fit everyone
Predefined answer choices can easily fail to reflect people’s full spectrum of identities, such as gender or religion. This lack of representation can cause people to feel unseen, which may affect data quality and trust in your brand/study.
3. Inaccurate question formatting
Even well-curated questions can produce misleading or unusable data if poorly phrased or ambiguous. Similarly, long lists of ethnicities or income brackets may be overwhelming or confusing, especially if options are in a biased order. This makes the data harder to analyze and compromises the accuracy of insights.
4. Legal and ethical considerations
Another major challenge is the legal and ethical responsibilities of collecting demographic information. The General Data Protection Regulation (GDPR) or the California Consumer Privacy Act (CCPA) limit how personal data can be stored, used, and shared. Thus, designing your survey in line with privacy should be noted.
5. Low completion or high drop-off rates
When demographic questions are asked at the beginning of a survey, they can lead to a higher drop-off rate. Factors like length, relevance, or sensitivity may cause the drop-off. This is particularly common in customer experience surveys or feedback survey design, where the participants mainly focus on sharing their opinions, not their background.
Best practices for asking demographic survey questions

1. Define a clear purpose
Start by asking: Why do you need each demographic field? Only collect data that supports actionable goals. This will foster trust and keep your dataset focused.
2. Use inclusive, respectful question design
Frame questions with thoughtful but professional question formatting, such as “Prefer to self-describe” instead of “Other.” Use question types such as multiple-choice or open-ended responses for complex identities, such as gender or ethnicity.
3. Be transparent and ask for the respondent’s consent
Inform respondents what you’re collecting, why, and how you’ll protect it. Offer opt-out options like “Prefer not to answer.” This aligns with fair information practices and encourages honest participation
4. Minimize collection
Only gather demographic information that aligns with your goals. Avoid unrelated details to reduce privacy risk.
5. Validate & organize inputs
Use formats like YYYY‑MM‑DD or ZIP codes, and set logical checks. Use consistent names and keep a clear list of data details (like field names, creation date, and owner) so everything stays easy to find and understand.
7. Build privacy into your process
Integrate privacy measures as the central aspect of your systems. Follow principles like anonymity by default and full-lifecycle protection.
8. Set clear rules for managing data
Assign data stewards for data quality, consistency, and policy compliance. Establish clear roles, review cycles, and protocols aligned with ISO, GDPR, or industry standards.
9. Keep data up to date
Set retention policies to remove outdated entries, if required. Conduct frequent audits to guarantee accuracy and compliance.
10. Report transparently and ethically
Be upfront about demographic breakdowns, even minor or sensitive segments. Explain the results (like any possible errors) and show how the findings help make decisions or promote fairness.
Pro tip: Improve survey reach with QR code forms
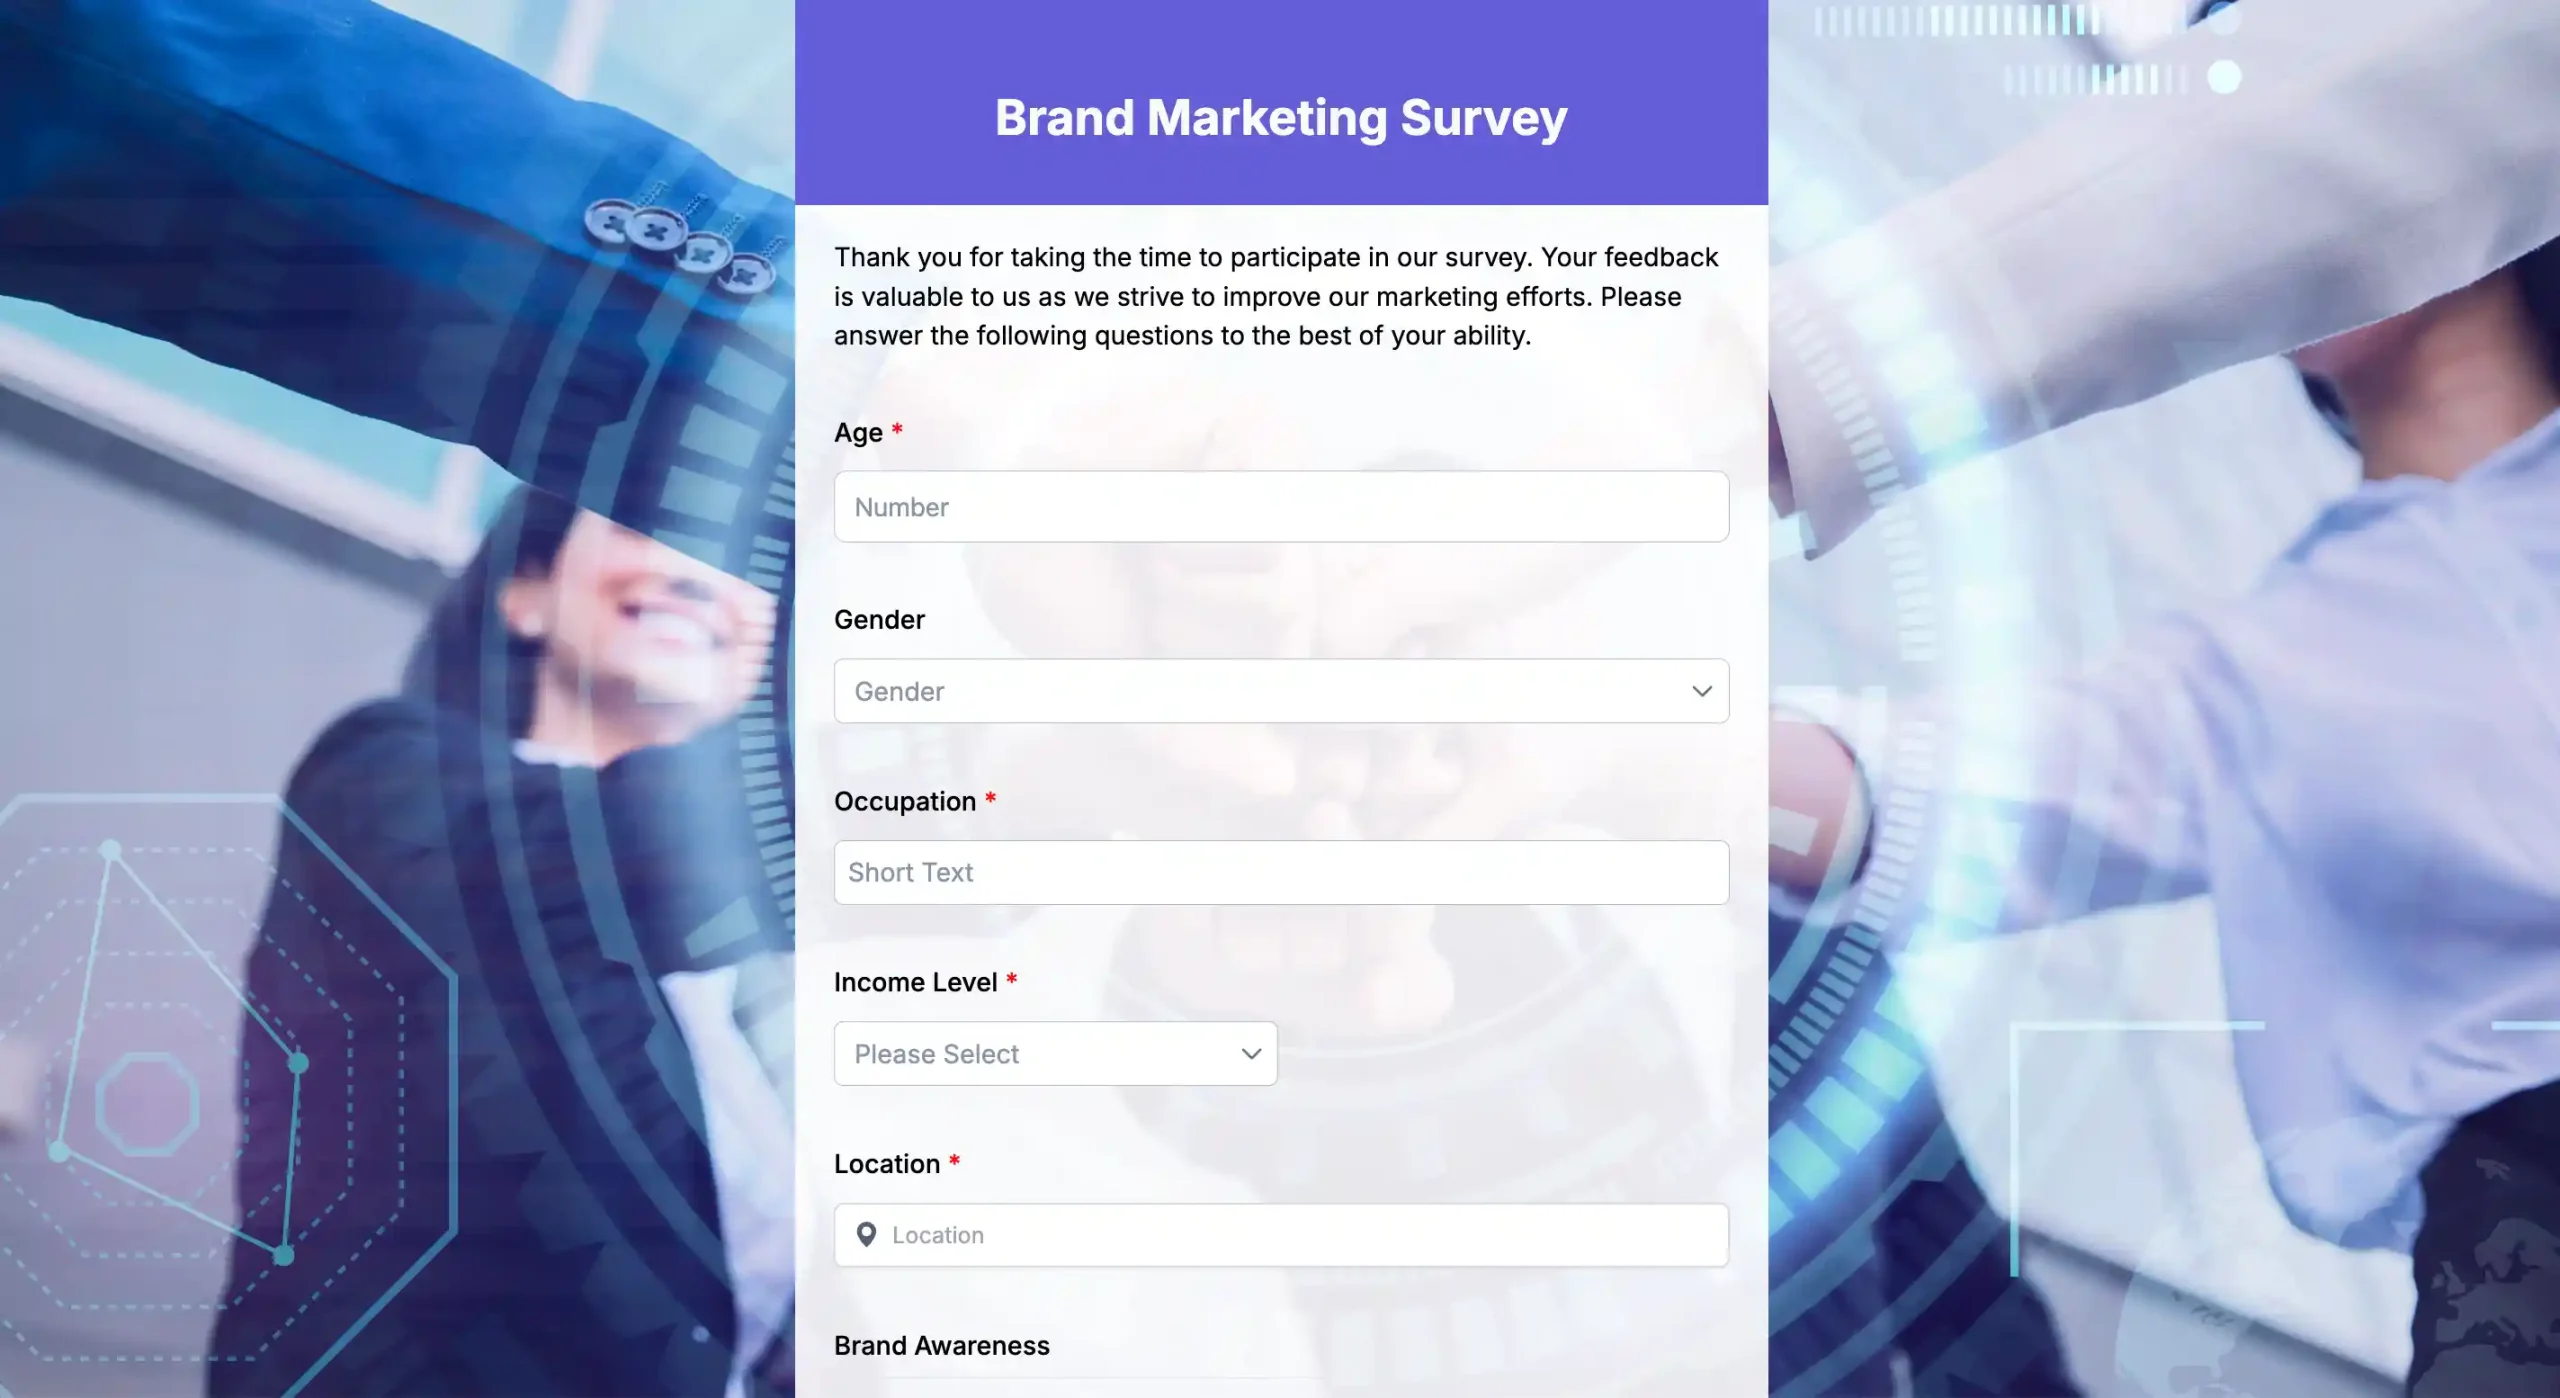
These days, manual and paper surveys are a struggle in a techy world. Hand distribution is slow, and errors slip in during manual entry. A QR code-based solution sidesteps these issues by letting people open a survey and questionnaire instantly on their phones with just one scan.
You can edit your form alongside the QR code-generating phase. Everything is managed in one interface for a simple and organized experience.
A solution such as TIGER FORM combines the usual drag-and-drop form builder with dynamic QR code functionality. Create your survey form, generate the code, and share it with your audience. A digital solution that collects cleaner data, reaches a broader audience, and saves hours on distribution.

Get better insights with the right demographic survey questions
The success of any survey depends on more than just asking good opinion questions. Understanding who your respondents are gives valuable context to every answer you collect.
By using the right demographic survey questions, you can identify trends, compare audience segments, improve decision-making, and create better products, services, and customer experiences. At the same time, it’s important to collect demographic information thoughtfully. Ask only relevant questions, use inclusive language, respect respondents’ privacy, and explain why you’re collecting their information.
If you’re conducting academic research, measuring customer satisfaction, or running a market research project, a well-designed demographic survey will help you turn responses into meaningful insights.
With an online form builder like TIGER FORM, you can quickly create professional surveys, share them using QR codes or links, and collect organized data that supports better decisions.
FAQs
What is the purpose of including demographic questions?
To understand who your respondents are, compare groups, and analyze results by characteristics like age, gender, income, and location.
How many demographic questions should I include?
Aim for a core set (e.g., 6–12) to balance insight with respondent burden; you can add optional questions if needed.
Which demographic questions are essential?
Common essentials include age or birth year, gender, location (country/region), education, and income or socioeconomic status.
How should I format age questions?
Use a single question for age range (e.g., 18–24, 25–34) or ask for birth year if you need precise analysis. Avoid asking exact dates unless necessary.
How do I classify gender respectfully?
Provide inclusive options (e.g., male, female, non-binary/third gender, prefer to self-describe, prefer not to say). Include an open-text option if needed.